






















Charging is the part of electric vehicle ownership most people get wrong on both ends. Shoppers overestimate how often they will need public DC fast charging and underestimate how cheap home charging is, while critics of the EV transition often undersell the pace of network buildout and oversell “range anxiety” as if it were the 2019 problem it no longer is. At the same time, the people actually building the charging network are wrestling with an economic structure that the typical consumer never sees — one where a single utility demand charge on a quiet fast-charging station can wipe out an entire month’s profit.
This article covers both ends. It walks through what EV drivers actually pay to charge in 2026, and it walks through what it costs to put a kilowatt-hour into their car — from the grid connection to the capital expenditure to the demand charges that still define whether DC fast charging makes money. It also covers the NACS/Supercharger realignment that reshuffled the competitive landscape in 2024 and 2025, and the grid upgrades that will determine whether the US network can actually support the vehicles already on the road, let alone the ones projected to arrive.
What the US Charging Network Actually Looks Like in 2026
The headline number is 253,000 public charging ports across the US as of 2026, a figure that has grown from roughly 97,000 in 2020. Of those, about 72,500 are DC fast-charging ports — the stations that can deliver 150kW to 350kW and move an EV from 10% to 80% in 20 to 35 minutes. The remaining 180,000 ports are Level 2 units at 240V, typically delivering 7kW to 11kW, which take four to ten hours to fill a battery.
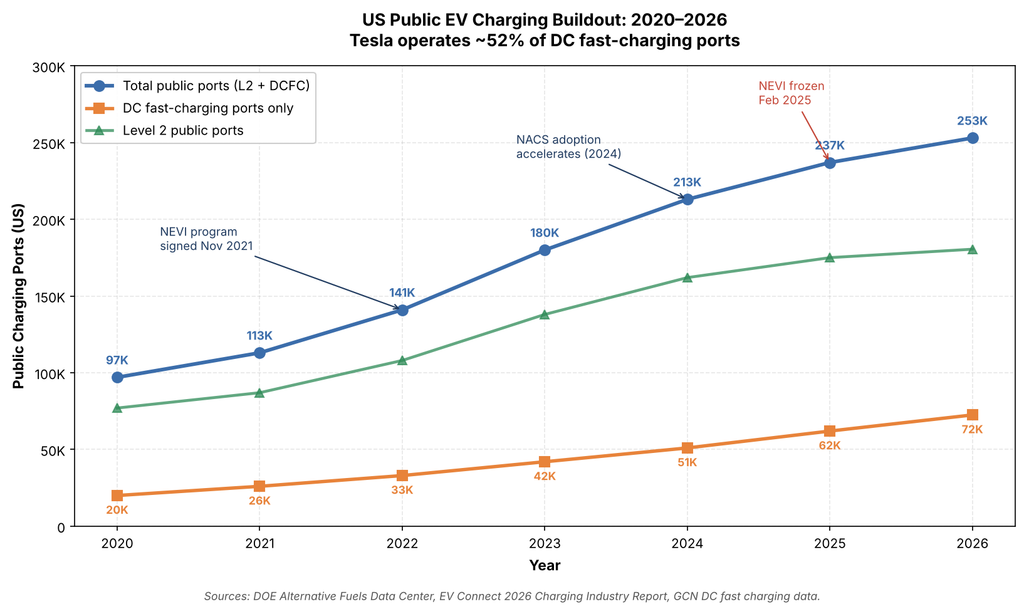
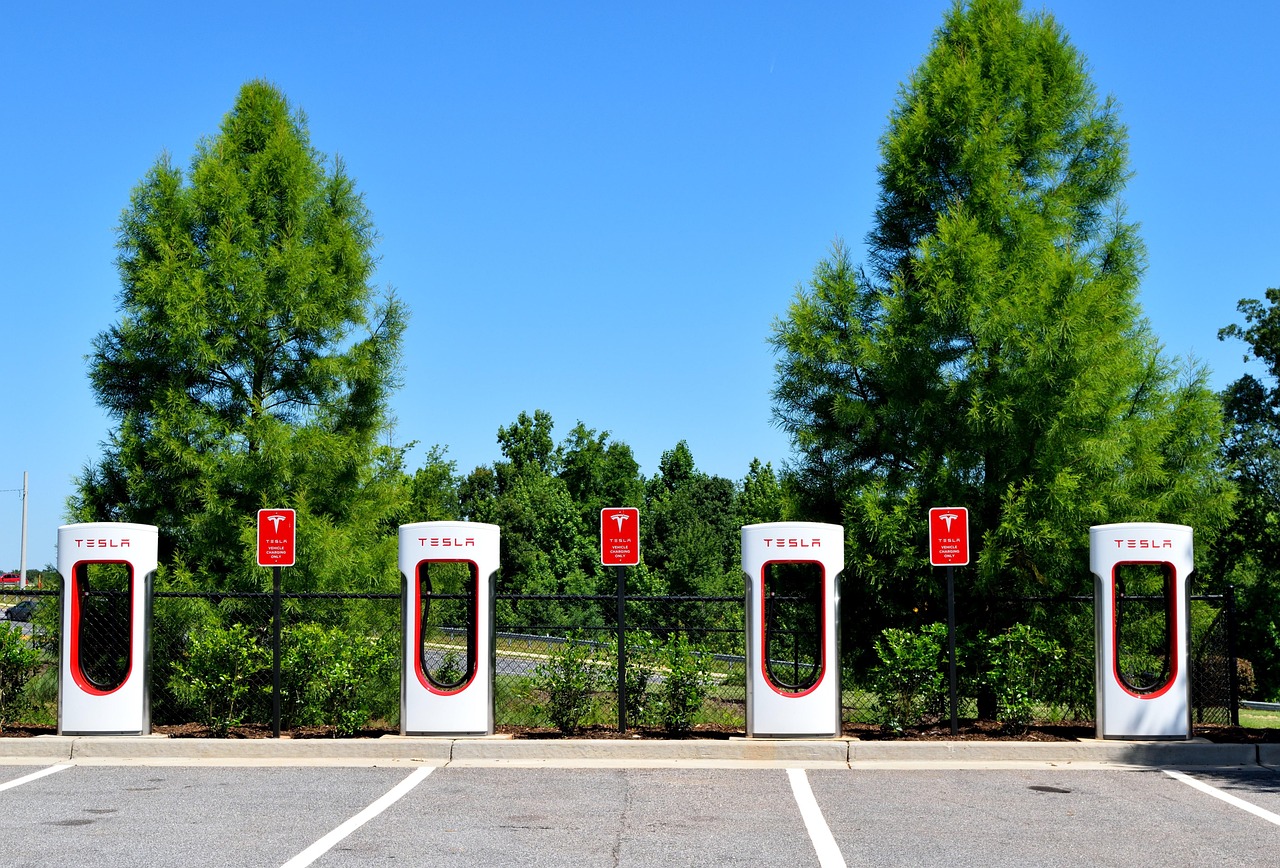
The DC fast-charging network has grown roughly 30% year over year, which is faster than EV sales growth. Tesla operates about 51.6% of US DC fast-charging ports — a share that has been gradually declining as competitors add capacity, but that still makes Tesla by far the largest DC fast charging network in the country. ChargePoint, EVgo, and Electrify America are the next three largest operators, with the top ten networks collectively running roughly 85% of total DC fast-charging ports.
The buildout trajectory has been uneven. The federal NEVI program signed into law in November 2021 allocated $5 billion to build out DC fast charging along interstate corridors, but the program was suspended by the Federal Highway Administration in February 2025 and Congress rescinded just over $503 million of the funding in January 2026. Despite that disruption, private capital, Tesla expansion, and state-level programs continued the buildout through 2025 and 2026. The pace is now less dependent on federal support than it was in 2022, which has changed the competitive landscape for operators.
The regional distribution matters. California, Texas, and Florida host the most stations; Alaska, the Dakotas, and large stretches of the mountain West remain thin, with 50-to-150-mile gaps on some corridors. Buyers evaluating EVs for road-trip use should check specific routes rather than the national total.
The Four Tiers of Charging and What Each One Costs
Most EV drivers do not think about public DC fast charging because they rarely use it. Industry data consistently shows that roughly 80% of all EV charging happens at home, and the remaining 20% splits between workplace, destination, and public fast charging. The cost per kilowatt-hour varies dramatically across those tiers, which is what makes total cost-of-charging estimates so dependent on the individual driver’s pattern.
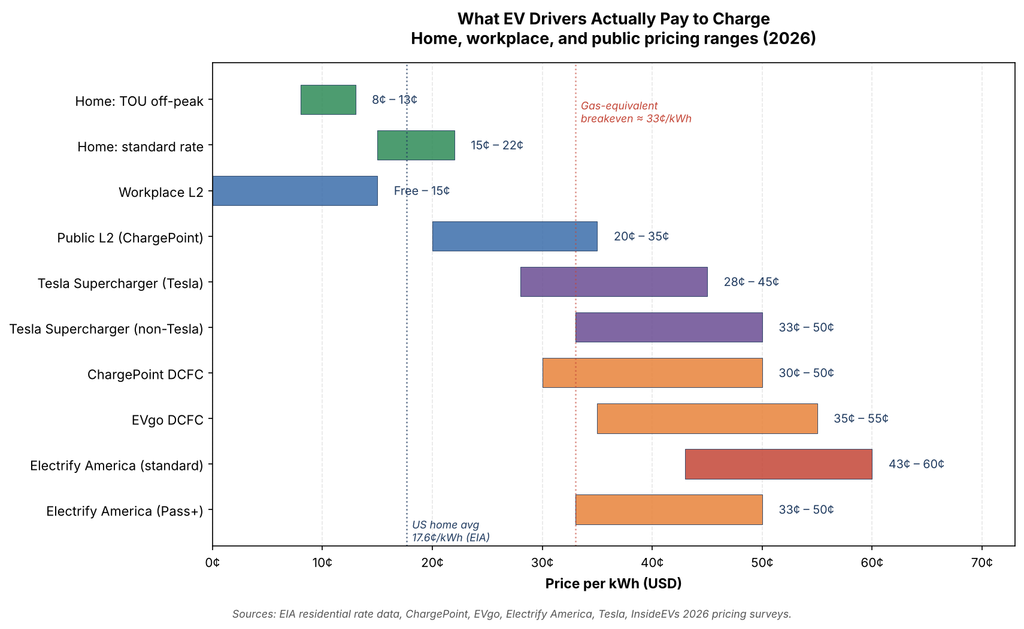
Home Level 1 and Level 2 charging is the cheapest tier by a wide margin. The US average residential electricity rate sits at about 17.6¢/kWh per EIA February 2026 data. Drivers on time-of-use (TOU) rates — available in most states that allow EV-specific rate plans — can charge overnight at 8¢ to 13¢/kWh in many markets. A Tesla Model 3 or Hyundai Ioniq 5 traveling 1,000 miles per month at 3.5 miles/kWh costs about $50 per month on TOU rates and about $75 on standard rates. The How Fuel Prices Affect Car Ownership article covers the comparative math against gasoline in detail.
Workplace Level 2 charging ranges from free (an employee perk) to roughly 15¢/kWh when employers pass along cost. For commuters, this often fully covers the day’s driving at zero marginal cost.
Public Level 2 charging at ChargePoint stations, hotels, and parking garages typically runs 20¢ to 35¢/kWh. Owners who rent, live in apartments without dedicated parking, or travel frequently use this tier more heavily than homeowners.
DC fast charging is where the economics change character. Electrify America, EVgo, and ChargePoint’s fast-charging prices range from about 30¢/kWh (ChargePoint low end) to 60¢/kWh (Electrify America standard pricing). Tesla Superchargers sit roughly in the middle at 28¢ to 45¢/kWh for Tesla vehicles, with non-Tesla EVs typically paying a surcharge of 5¢ to 7¢/kWh. Subscriptions help — Electrify America’s Pass+ membership drops the standard $4/month 43¢–60¢ rate to 33¢–50¢/kWh, and EVgo and ChargePoint offer similar tiers.
The practical implication is that a driver who charges 80% at home and 20% on DC fast is paying dramatically less per mile than one who relies on fast charging alone. For the first group, EVs undercut gasoline cars on energy cost by a wide margin. For the second group — typically apartment dwellers without home charging access — the per-mile cost can approach or match the per-mile fuel cost of a gasoline hybrid.
Why DC Fast Charging Costs 3× Home Charging: Demand Charges
The gap between 17.6¢/kWh at home and 50¢/kWh at a public DC fast charger is not primarily a profit margin. It is the direct result of how commercial electric utilities bill high-power customers.
Most commercial customers pay for electricity in two buckets. The first is energy charges, a per-kWh price similar to residential billing. The second is demand charges, a monthly fee based on the single highest kilowatt draw during any 15-minute period in the billing cycle. For a residential customer, demand charges do not exist because their peak draw never reaches a level the utility cares about. For a four-port 150kW fast-charging station, the theoretical peak draw is 600kW. If just one of those ports hits full power during the billing month, the demand charge on 600kW at a typical rate of $20/kW is $12,000 for that single month — regardless of how much energy was actually delivered.
A station that serves one car per day across all four ports might sell 2,000kWh in a month and collect roughly $900 in revenue, while the demand charge alone costs $12,000. Research by the Transportation Energy Institute and others has documented demand charges consuming 40% to 90% of operating cost at underutilized stations — a structure that makes the first years of a new station economically brutal until traffic builds up.
Utilities are slowly restructuring demand-charge policies in response. California, New York, and several Northeast states have introduced reduced demand-charge tariffs for DC fast charging during the buildout phase. Some utilities offer “demand-charge holidays” for the first three to five years after station commissioning. The problem is not solved — it is actively being negotiated utility by utility, state by state — but the trajectory is moving in favor of station operators.
The Economics of Operating a Charging Station
The gap between what drivers pay and what it costs to deliver that kWh is where the real buildout question lives. A hypothetical four-port 150kW station in California — the benchmark case studied by McKinsey’s charging profitability research — looks something like this:
- Hardware capex: $45,000 to $100,000+ per 150kW–350kW charger, times four, plus site work
- Installation and grid upgrades: $40,000 to $150,000+ per unit, with transformer upgrades sometimes running into the millions on sites that need distribution-level work
- Annual capex depreciation: approximately $85,000 to $95,000 without subsidies
- Annual operating expenses: $220,000 to $250,000 including electricity purchase, demand charges, maintenance, and administration
- Revenue at 15% utilization (industry benchmark): $265,000 to $285,000 at 45¢/kWh retail
That translates to an operating loss of roughly $40,000 to $50,000 per year without subsidies, or a modest profit of $25,000 to $30,000 with federal and state incentives applied.
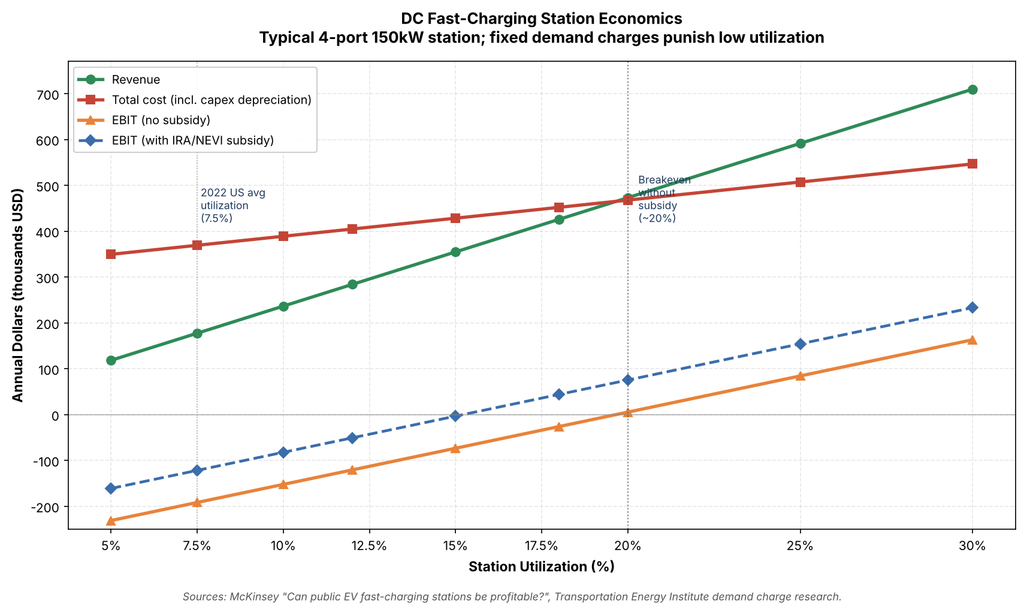
The 2022 US national average utilization for DC fast-charging stations was around 7.5%, and even the highest recorded month averaged roughly 12%. California, with its much denser EV fleet, runs higher. The upshot is that most DC fast-charging stations outside major metros do not break even without either subsidies or materially higher traffic. McKinsey’s model shows breakeven at approximately 20% utilization without subsidies, 15% with them.
This is why the companies that have scaled fastest are those with ancillary revenue streams. Tesla’s Supercharger network benefits from vertical integration — the stations exist to make Tesla vehicles more attractive, not primarily to generate standalone profit. Walmart, Love’s Travel Stops, Sheetz, and Pilot Flying J are adding chargers because they bring customers inside the convenience store. Hotel chains including Marriott and Hilton have begun deploying L2 charging for similar reasons. Pure-play operators without those tie-ins face the hardest math.
The Inflation Reduction Act provides up to a 30% federal tax credit on charging equipment, capped at $100,000 per charger, for stations in low-income or non-urban census tracts through December 2032. State-level programs in California, New York, and the Northeast add incremental funding. The suspended NEVI program previously funded up to 80% of qualifying projects — a level of support that made many corridor stations viable and whose absence has slowed some projects.
The NACS Story: How Tesla Changed the Competitive Landscape
The single largest structural change to US charging infrastructure in the last three years has been the industry-wide adoption of Tesla’s charging connector — the North American Charging Standard (NACS). In 2022, Tesla’s Supercharger network was closed to non-Tesla vehicles in the US. By late 2026, essentially every major automaker selling EVs in the US has either committed to NACS on future vehicles or shipped adapters allowing their current CCS-equipped vehicles to use Superchargers.
Ford was first, gaining Supercharger access in late February 2024. Rivian followed, with R1S and R1T access and free adapters shipped to owners and included with new vehicles. General Motors — Chevrolet, GMC, and Cadillac — followed, with its own branded adapter. Hyundai and Genesis gained access in March 2025 with complimentary adapters. Kia, Honda and Acura, Volvo, Polestar, Nissan, Lucid, Mercedes-Benz, Toyota, Subaru, Lexus, Volkswagen, BMW, Stellantis, Audi, Porsche, and Jaguar have all followed, with adapter arrangements ranging from free to $230 depending on brand. Mercedes charges $185, Volkswagen $200, and Stellantis $230 for their approved adapters. For 2026 model years, many brands including Toyota, Subaru, and Lexus include the adapter with new vehicles.
The practical effect for drivers is that Tesla’s roughly 2,900+ Supercharger stations and about 32,000+ stalls in the US are now available to drivers of almost any new EV. For many brands, that doubled or tripled the practical DC fast-charging network accessible to their owners overnight. The non-Tesla access typically includes a small per-kWh premium of 5¢ to 7¢ and requires only V3 or V4 Supercharger stalls with the black collar on the handle — older V2 stations remain Tesla-only in most cases.
The structural implication for the market is that Electrify America, EVgo, and ChargePoint now compete directly with Tesla for every EV driver’s charging dollar, not just Tesla owners. Tesla’s cost structure is lower because the Supercharger network was built partly as a capital-efficient marketing asset for vehicle sales; competitors built their networks to stand alone as businesses, with higher per-charger costs that they now have to recover against Tesla’s pricing. The outcome has been a gradual repricing of DC fast charging across the industry, with several networks dropping headline rates or expanding subscription discounts to stay competitive.
Who Pays for the Buildout: NEVI, Utilities, and Private Capital
The question of who foots the bill for the charging network has four main answers in 2026: the federal government through NEVI and the IRA tax credits (reduced after the NEVI pause), state governments through parallel programs, private operators including automakers and pure-play networks, and electric utilities themselves through rate-base investments approved by state regulators.
The utility channel is the one most consumers do not see. Investor-owned electric utilities in California, New York, New Jersey, Illinois, Colorado, and several other states have been authorized to spend billions on charging infrastructure — either owning the stations outright (common in California) or funding “make-ready” grid upgrades up to the charger pedestal (common in the Northeast). Those investments are recovered through electric bills across the utility’s entire customer base, which effectively socializes part of the buildout cost. The approach is controversial because non-EV customers help pay for infrastructure they don’t use, but it accelerates deployment in markets where private capital alone would move more slowly.
Automaker investments have become more significant as the NACS transition progressed. Tesla continues to invest heavily in Supercharger expansion. Ford, GM, and the “Ionna” joint venture — which includes BMW, Honda, Hyundai, Kia, Mercedes-Benz, and Stellantis — are building their own fast-charging networks, with Ionna targeting at least 30,000 stalls by 2030. The pattern mirrors the way early gasoline-era oil companies built branded filling stations to drive loyalty.
Pure-play private capital from firms like ChargePoint, EVgo, Blink, and Francis Energy continues to fund a meaningful share of the network, though these companies have faced persistent profitability challenges. Several have gone public via SPAC and seen their valuations contract sharply as the operating math proved harder than initial projections.
Consumers ultimately fund the buildout three ways: directly through what they pay to charge, indirectly through utility bills, and indirectly through federal and state taxes. The ratio among those three varies by state and continues to evolve.
The Grid Problem: More Chargers Means More Transformer Upgrades
Adding DC fast-charging stations is not just a question of pouring concrete and running conduit. Every 150kW to 350kW charger draws loads that can exceed the capacity of the distribution feeder serving its location, and every four-charger station pushes draws into the low megawatt range that requires substation-level planning.
The scale is significant. In California, where EV adoption is highest, grid planners estimate that a majority of distribution feeders will need capacity upgrades by 2045 to support the full transition, with tens of gigawatts of new capacity required at an estimated cost of billions of dollars. In Massachusetts, EV deployment aligned with state clean-energy targets could add over 1,500 MW to peak demand by 2030 and roughly 4,000 MW by 2035. Nationally, by 2030, up to 11% of distribution feeders could be overloaded and about 10% of substations are at risk without managed-charging intervention.
The good news is that managed charging — software that shifts loads away from the grid’s peak hours — materially reduces those numbers. Modeling shows that aggressive managed-charging deployment could cut 2030 feeder overloads to 2% and limit 2035 substation overloads to 6%. Tesla’s Supercharger network, home-charging networks that respond to utility signals, and DC fast-charging stations with on-site battery storage all help flatten the load curve. The How EV Thermal Management Affects Performance article covers how on-vehicle systems also contribute to charging efficiency.
The grid buildout is now understood to be the real rate-limiting step for US EV adoption, more than vehicle availability or sticker price. Interconnection queues at major utilities are backed up by 24 to 48 months in some regions, which means new DC fast-charging stations in constrained areas can face multi-year waits for grid connections even when the capital and the land are ready.
What This Means for EV Shoppers
For most buyers shopping an EV in 2026, the practical implications of the charging economics are these:
- Home charging access is the single biggest determinant of EV cost-effectiveness. A homeowner with a Level 2 charger or even a dedicated 120V outlet will pay less per mile than almost any gasoline vehicle. An apartment dweller relying primarily on DC fast charging will pay more per mile than a gas vehicle in many cases.
- Public DC fast-charging reliability has improved significantly but still varies by network. Tesla’s Supercharger network remains the most reliable, with 99%+ uptime at the typical station. Electrify America, EVgo, and ChargePoint have closed much of the gap over the last two years but still see higher failure rates.
- The NACS transition means that compatibility is largely solved for new vehicles. A 2026 model-year EV from almost any major brand can plug into the vast majority of US DC fast-charging infrastructure, either natively or with an adapter.
- Range anxiety is primarily a corridor problem, not a national one. Interstate travel on major routes is well-supported; secondary and rural routes still have gaps. Checking the specific routes you drive against PlugShare or A Better Routeplanner is more useful than any national statistic.
- Pricing differences matter on long trips. For a driver taking a 600-mile road trip, the difference between 33¢/kWh and 55¢/kWh translates to roughly $35 extra in charging cost. Loyalty programs and subscription tiers are worth considering for high-mileage drivers.
The Future of Solid-State Batteries in EVs and EV Fast-Charging Curves articles cover the vehicle-side developments that will continue to reshape the charging equation.
The Takeaway
The economics of US EV charging infrastructure in 2026 are complicated, uneven, and in active transition — but they are also real economics, with real buildout happening and real competitive dynamics shaping prices. Public charging today is three to four times more expensive than home charging because the cost structure behind a DC fast-charging station is fundamentally different from a residential wall outlet, dominated by demand charges, capital depreciation, and low average utilization. Those gaps are narrowing as traffic grows and utilities restructure demand charges, but they will not disappear.
The NACS transition has reshuffled the competitive map, making Tesla’s Supercharger network the de facto national backbone and forcing competitors to either match Tesla’s pricing or compete on location and amenities. The grid upgrade cycle, not the charger-manufacturing cycle, is now the real throttle on how fast the US network can scale. And for individual shoppers, the question of whether EV ownership saves money comes down less to the sticker price of the vehicle than to whether they can charge at home.
Treat the headline “253,000 chargers” number as context, not conclusion. The real story is in the pricing, the utilization, and the grid.
External Sources
- DOE Alternative Fuels Data Center — US Public Charging Station Count
- EV Connect — 2026 EV Charging Industry Report
- Basenor — Tesla Holds 52% of US DC Fast Charging Market
- InsideEVs — All Non-Tesla EVs That Can Use Tesla Superchargers (2026)
- GreenCars — NEVI Charging Network Reboots in 2026
- McKinsey — Can Public EV Fast-Charging Stations Be Profitable in the US?
- ScottMadden — Taming the Electric Vehicle Demand Charge
- RealClearWire — Demand Power Charges: The Achilles Heel of a Nationwide EV Fast-Charging Network
- Joule.io — EV Charging Cost Guide 2026
- EIA — Residential Electricity Rate Data
- KBB — How Much Does It Cost to Charge an EV?
- NREL — Grid Impact of EV Charging Infrastructure
- Basenor — NACS Is Now the Default
























Leave a Reply
You must be logged in to post a comment.