





























When an insurance company quotes you a premium, it is not pulling a number out of the air. Behind every quote sits a pricing model that combines dozens of variables — your driving record, the vehicle you drive, where you park it, how far you commute, your credit history, the claim history of every driver who ever owned the same model, and in many cases the actual way you drove last Tuesday afternoon. Some of those variables you can change. Most of them you cannot. The variables you can influence do more than people realize, and the ones you cannot move anchor the bottom of what you can ever get your premium down to.
This article walks through how insurers actually build the risk assessment behind a quote — what data goes in, how it gets weighted, and why two neighbors with the same vehicle and seemingly similar profiles can end up paying very different premiums. It covers the vehicle side, the driver side, the location side, the credit side, and the rapidly growing telematics side. And it covers the practical levers a shopper can actually pull to reduce what they pay, which is the point of understanding the methodology in the first place.
What an Auto Insurer Is Actually Buying
The starting point for understanding how risk gets priced is that insurers are not insuring vehicles. They are insuring the probability that a specific driver, in a specific vehicle, in a specific place, over a specific period of time, will cause or suffer losses the insurer has to pay for. That probability is called expected loss, and it gets built from four main components: how likely a claim is (claim frequency), how expensive the average claim will be (claim severity), the insurer’s fixed costs of administering the policy, and a margin that varies by state regulatory environment and company strategy.
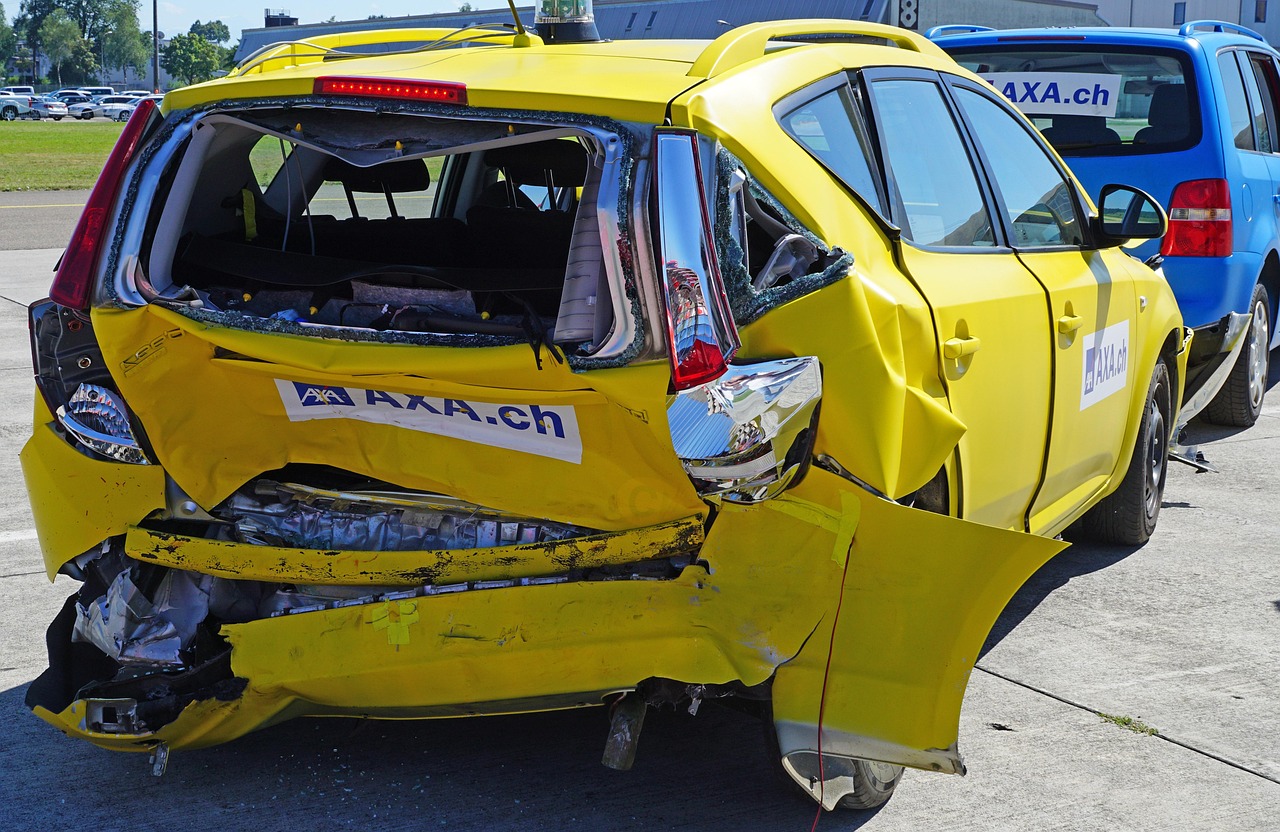
Every input to the rating model feeds into either frequency or severity. A sports car’s high horsepower drives frequency because drivers of high-performance vehicles have higher claim rates. The same car’s expensive body panels and specialized parts drive severity because any claim it does file costs more to pay out. A parking lot ZIP code in Chicago drives both frequency (more collisions, more theft) and severity (higher labor rates, higher medical costs). A driver with excellent credit statistically files fewer claims than a driver with poor credit, which drives frequency. A teen driver combines bad frequency scores (inexperience) with mediocre severity scores (smaller, cheaper vehicles they tend to drive), with the frequency effect dominating the math.
Insurers spend enormous resources collecting, cleaning, and validating this data. The Insurance Services Office (ISO) and the Highway Loss Data Institute (HLDI) aggregate claim data across the industry; the National Insurance Crime Bureau (NICB) tracks theft patterns; state DMVs supply driving record data. Each insurer then layers its own underwriting rules on top of that shared data and runs its own proprietary models. That is why the same driver can get wildly different quotes from different carriers — not because one company is “wrong,” but because each one is weighting the inputs slightly differently.
The Vehicle Side: Make, Model, and Loss History
The vehicle itself is a significant driver of premium, but not for the reasons most shoppers assume. The purchase price matters less than the loss history of the specific make, model, trim, and model year. HLDI publishes annual loss data by vehicle — collision claim frequency, collision claim severity, comprehensive claim frequency (mostly theft, weather, vandalism), medical payment frequency, and bodily injury severity — and insurers use this data to assign each vehicle a set of relativity factors.
A Toyota Camry four-door with a decent-driver profile often lands in the bottom quartile of per-vehicle premium because it has below-average collision frequency, below-average theft rates (despite being #8 on the overall stolen-vehicle list, its sheer population means the per-vehicle theft rate is lower), and manageable repair costs. A Ford Mustang Shelby GT500 in the same ZIP code with the same driver can run three times higher because its collision frequency is elevated and its repair costs run heavy.
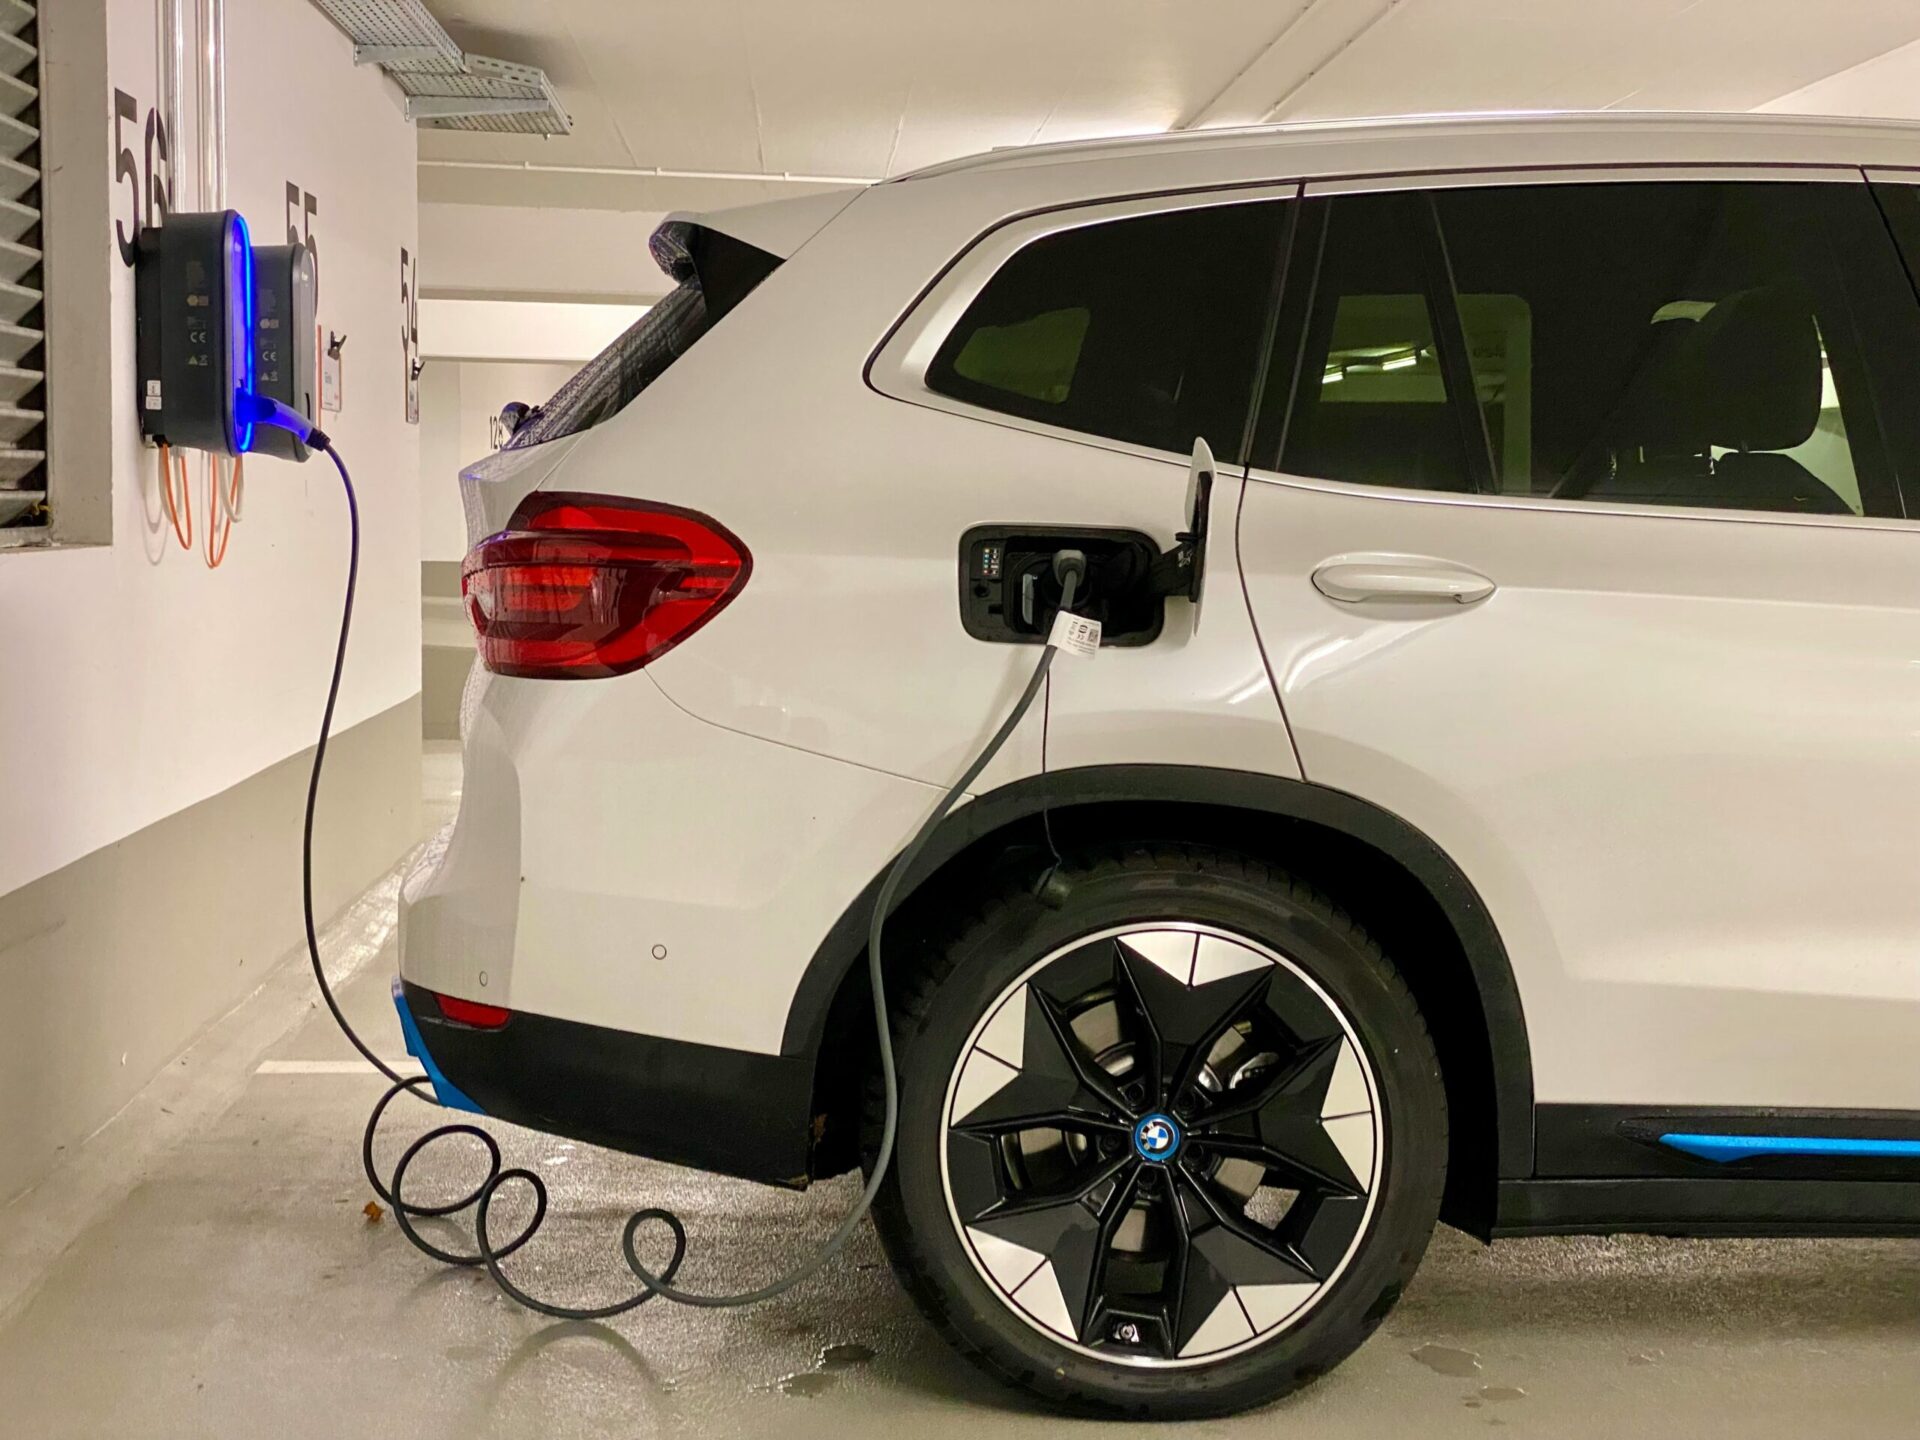
Luxury and performance brands typically carry higher premiums because of parts and labor costs. A fender bender on a BMW that uses aluminum body panels and requires manufacturer-trained technicians can run $8,000–$12,000 for repairs that would cost $3,000 on a Toyota. Mercedes-Benz, Audi, Porsche, Jaguar, and Land Rover vehicles typically rate in the top quartile for severity. Tesla’s premiums have historically run high despite excellent safety ratings because specialized repair networks and lengthy wait times for parts raised severity costs — a dynamic covered in detail in the Why EVs Have Different Insurance Costs article.
Theft rates feed directly into the comprehensive portion of the premium. The 2025 NICB rankings show a pattern that has held steady for several years:
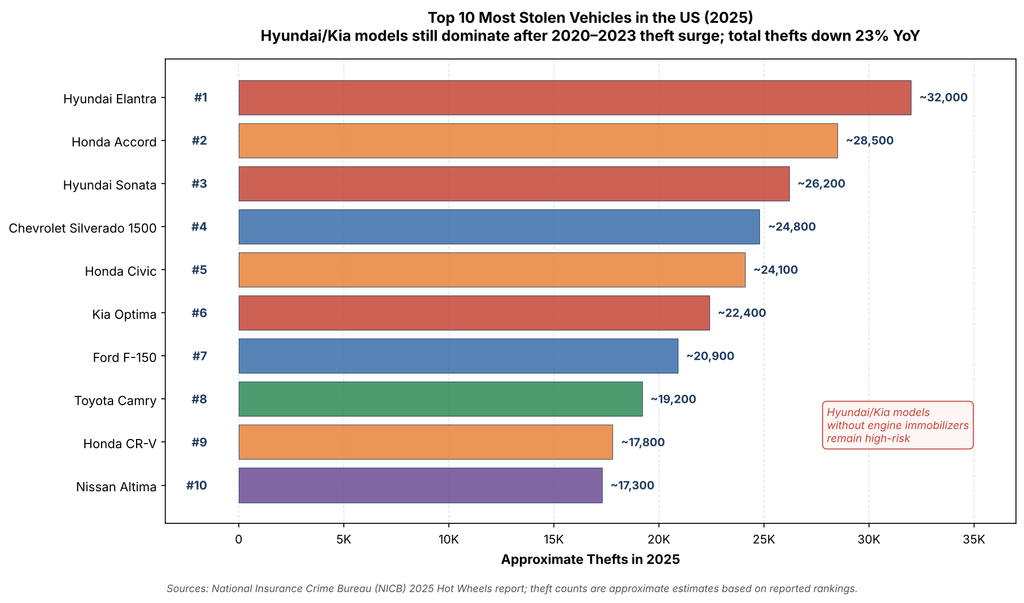
Hyundai and Kia models (Elantra, Sonata, Optima) continue to dominate the top of the list — a legacy of certain model years built without engine immobilizers that became viral targets on social media between 2020 and 2023. Total US vehicle thefts fell 23% year-over-year in 2025, which is a meaningful improvement, but the brand-specific premium impact on affected Hyundai and Kia vehicles persists in many states even for owners who never experience a theft. Honda Accord, Honda Civic, and Honda CR-V appear because of their sheer volume — they are among the most common vehicles on the road, which gives them high absolute theft counts even at average per-vehicle theft rates. Chevrolet Silverado 1500 and Ford F-150 appear because full-size pickups have been consistent theft targets for their resale value in parts.
Buying a vehicle on the top-stolen list does not automatically mean higher comprehensive premiums — insurers look at the specific model year and anti-theft equipment installed — but it is worth checking before committing to a particular model.
The Driver Side: Record, Age, and Credit
Driver characteristics typically outweigh vehicle characteristics in determining a premium. An unblemished 45-year-old with 20 years of clean driving history, excellent credit, and a 5-mile commute will pay less for a loaded luxury SUV than a 22-year-old with a speeding ticket will pay for a modest sedan.
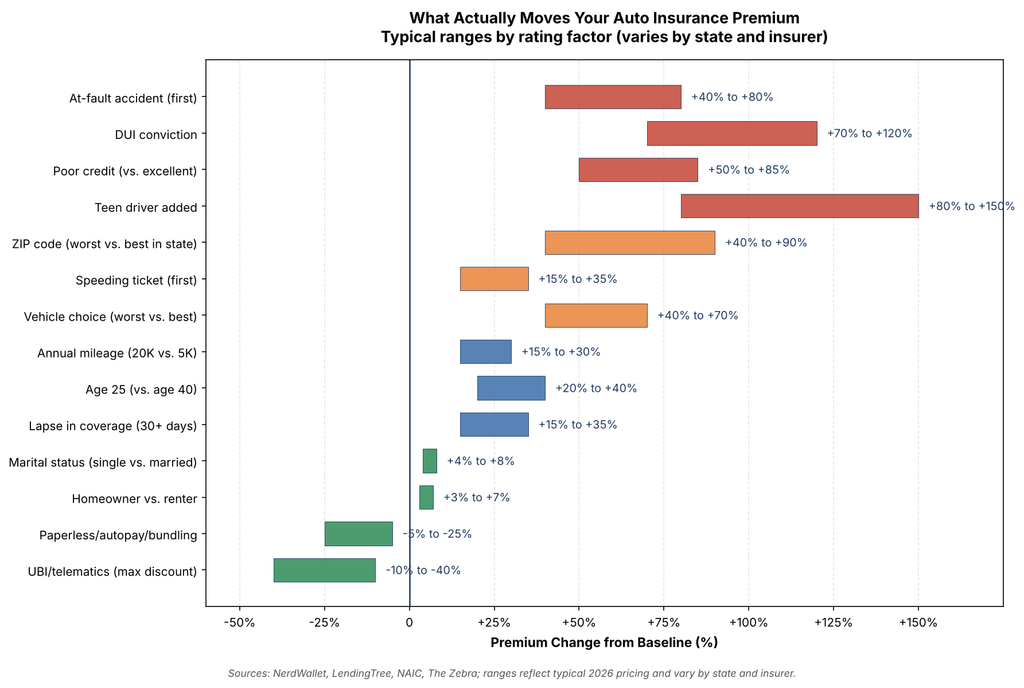
Driving record is the single most influential single factor an insurer looks at. A first at-fault accident typically raises premiums 40–80%, with the surcharge persisting for three to five years depending on the state. A DUI conviction can raise rates 70–120% and often triggers mandatory SR-22 filings that extend the premium impact for three years or longer. A speeding ticket typically adds 15–35% to the next renewal. Multiple violations compound non-linearly — two tickets in a year hurt more than twice as much as one.
Age and experience matter dramatically at the extremes. Drivers under 25, especially under 20, pay premiums roughly 80–150% above the reference adult rate. Drivers over 70 begin to see premiums rise again as crash rates climb with age. The 35–60 window is generally the lowest-cost age bracket, all else equal.
Credit-based insurance scoring is the factor that surprises most shoppers. In the 46 US states that allow it, credit information significantly influences premiums. A LendingTree analysis found good-credit drivers averaging $2,277 per year for full coverage on a 2018 Honda CR-V EX, while poor-credit drivers with identical records paid $3,831 — a 68% increase. The difference is comparable to what many drivers see after a DUI. California, Massachusetts, Hawaii, and Michigan prohibit credit-based insurance scoring; in those states the premium gap between good and poor credit drivers of otherwise identical profiles is zero.
The credit scoring insurers use is not the same as a FICO score, though it is calculated from similar underlying data. “Insurance scores” weight payment history, credit utilization, length of credit history, and recent inquiries differently than lending scores do, with longer-lived factors (payment history on existing accounts) getting more weight than short-term ones (recent inquiries).
Claims history influences future premiums even for claims that weren’t the driver’s fault. Not-at-fault claims generally don’t trigger surcharges in most states, but they do appear on CLUE (Comprehensive Loss Underwriting Exchange) reports and can affect how insurers underwrite the policy. Owners who file multiple small comprehensive claims for things like minor hail damage can see premium increases that cost more over three years than paying the claims out of pocket would have.
Marital status, homeownership, education, and occupation all enter most insurers’ models, though each with a smaller effect — typically 3–8% in either direction. These are proxies for stability that correlate with claim frequency in large population data.
The Location Side: ZIP Code Economics
Where a vehicle is garaged — not where the driver works or lives — determines the territorial rating factor, which is one of the most consequential inputs in the model. The best-rated ZIP code and the worst-rated ZIP code in the same state can produce a 40–90% premium difference for otherwise identical drivers.
The factors that go into territorial rating include local crash frequency per registered vehicle, theft rates, vandalism rates, uninsured motorist percentages, medical cost levels, litigation environment (some states and counties have historically produced more and larger bodily injury settlements), weather-related claim rates (hail belts, hurricane zones, snow regions), and road density and traffic congestion. Dense urban ZIP codes almost always rate higher than suburban or rural ones in the same metro. Detroit, Baltimore, St. Louis, Atlanta, and parts of Los Angeles consistently rank among the most expensive insurance ZIP codes in the country.
The vehicle usage pattern matters alongside location. A commuter driving 20,000 miles per year through heavy traffic into Boston carries a different risk profile than a retiree who drives 5,000 miles per year mostly on back roads. The difference typically shows up as a 15–30% premium impact for the high-mileage profile, with the gap widening when telematics data is in play.
The Telematics Revolution: Usage-Based Insurance
The rating model described above relies on proxies — your age, your ZIP code, your vehicle — to estimate how you probably drive. Telematics-based insurance replaces proxies with direct measurement of how you actually drive. The shift has been one of the most significant structural changes in auto insurance pricing in decades, and nearly every major carrier now offers at least one telematics program.
The mechanics vary by program, but the common pattern is a 30 to 180-day monitoring window during which the insurer’s app (or a plug-in device) tracks acceleration, braking, cornering forces, time of day, miles driven, and in some cases phone use while driving. The driver then receives an adjusted rate based on the measured behavior.
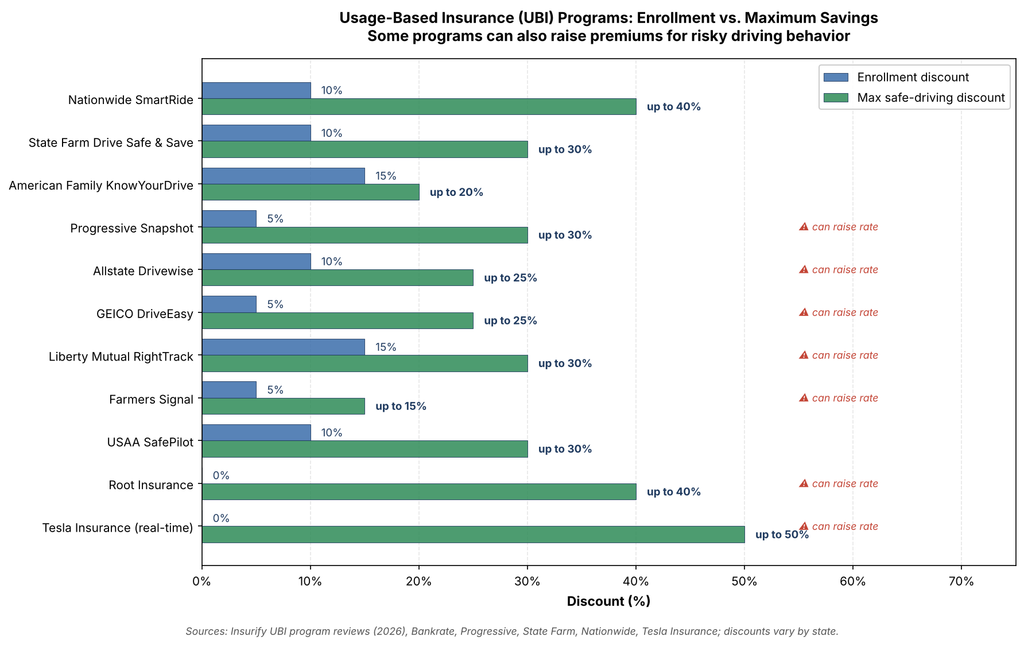
Enrollment discounts — a modest guaranteed savings for signing up — range from 5% (Progressive, GEICO) to 15% (Liberty Mutual, American Family). These apply immediately and typically stay in place through the monitoring period regardless of driving behavior.
Maximum safe-driving discounts are the headline numbers UBI programs advertise, and they range widely: Nationwide SmartRide and Root Insurance top out at 40%, Tesla Insurance at 50%, while State Farm Drive Safe & Save, Progressive Snapshot, USAA SafePilot, and Liberty Mutual RightTrack cap at 30%. Allstate Drivewise and GEICO DriveEasy max out around 25%, Farmers Signal at 15%. The actual discount achieved depends on how consistently safe the measured driving is — the maximum requires essentially perfect behavior.
Penalty risk is the factor UBI shoppers often overlook. Several programs can raise premiums if driving behavior is poor — Progressive Snapshot, Allstate Drivewise, GEICO DriveEasy, Liberty Mutual RightTrack, and Farmers Signal all have this risk, as do Root and Tesla Insurance which price entirely on behavior. State Farm Drive Safe & Save and Nationwide SmartRide are the notable exceptions that do not raise rates for risky driving. For drivers who know they occasionally brake hard or drive late at night, picking a program that cannot penalize them matters.
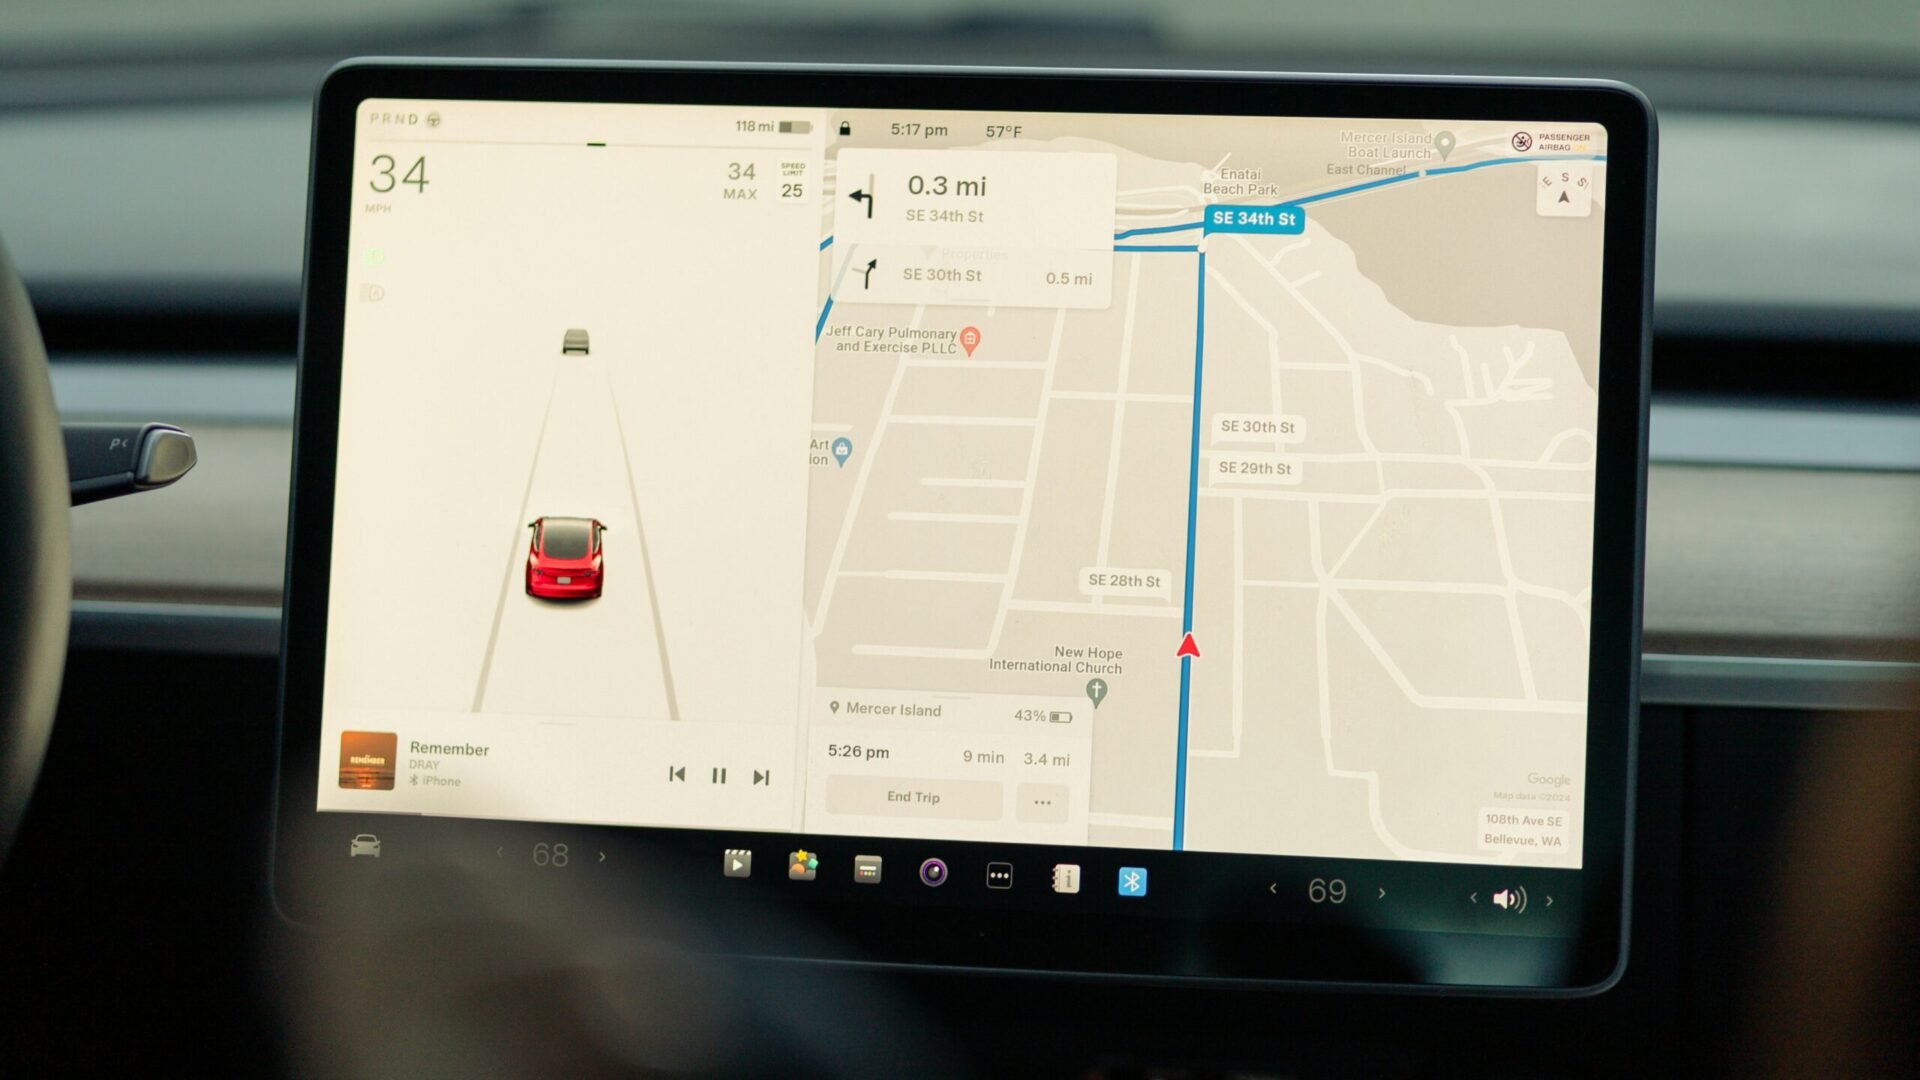
Tesla Insurance operates differently from traditional UBI programs. It is available in a growing number of states and calculates premiums monthly based on a real-time Safety Score computed from the vehicle’s own sensors. The Safety Score weights forward collision warnings, hard braking events, aggressive turning, unsafe following distance, forced autopilot disengagement, and late-night driving. Drivers with Safety Scores in the mid-90s or higher routinely report Tesla Insurance premiums 30–50% below traditional carriers for the same coverage. Drivers with Safety Scores in the 70s or lower often find Tesla Insurance more expensive than conventional options.
Privacy considerations are real and worth weighing. Telematics apps transmit location data, time stamps, and detailed driving metrics to the insurer. Most insurers claim they don’t share this data with third parties, but the data does become part of the insurer’s record and can be used for claim investigations. Drivers uncomfortable with that surveillance should factor it into whether a 15–30% discount is worth the tradeoff.
The usage-based market is growing quickly. Industry estimates suggest 25–30% of US policies will include some telematics component by 2027, up from under 15% in 2022. For drivers who are confident their driving is above average, UBI is one of the few remaining large levers for lowering premium.
What Shoppers Can Actually Control
A fair amount of insurance pricing is locked in by factors a driver can’t change in the short term — their age, their state’s regulatory environment, their existing driving record, their credit score (which is slow to move). The practical shopping question is which levers actually move the needle, and when to pull each one.
The highest-impact controllable levers:
- Shop every renewal cycle. Insurers reprice internally more aggressively than they adjust existing customers, which means loyalty often costs money. A full market shop every one to two years typically produces 10–25% savings for drivers whose risk profile has stayed stable or improved.
- Bundle home or renters insurance with auto. The typical multi-policy discount is 10–20% off auto and 5–15% off home or renters.
- Enroll in telematics if confident in driving behavior. 15–40% potential savings; verify the specific program doesn’t penalize before signing up.
- Raise collision and comprehensive deductibles to $1,000 or $2,500. Reduces premium typically 15–30% on a vehicle where collision/comp is a meaningful share of the premium.
- Drop collision and comprehensive on older vehicles. Rule of thumb: once the annual premium for collision+comp exceeds 10% of the vehicle’s actual cash value, dropping that coverage becomes financially sensible.
- Add safety-course discounts and defensive-driving credits. 5–10% discount in most states, especially for drivers over 55.
- Improve credit score over time in the 46 states where credit affects rating. Not immediate, but one of the highest-ROI long-term moves.
- Choose vehicles with low HLDI loss ratings before buying. The Which Factory-Order Options Are Worth It article covers related vehicle-choice factors.
The lower-impact but still worth-doing levers include paperless billing (3–5% discount), autopay (3–5%), paying in full rather than monthly (5–8%), and homeowner status for renters who become owners (3–7%). Combined, these housekeeping discounts can add up to 10–15%, which is not nothing.
The How Fuel Prices Affect Car Ownership and Total Cost of Ownership Beyond the Purchase Price articles cover how insurance fits into the broader cost picture for a vehicle purchase decision.
Where the Model Can Mislead
Insurance pricing is statistically sophisticated, but the model’s validity depends on the quality of the data feeding it. A few places where the model systematically misses:
Credit-based scoring disadvantages drivers who have low credit for reasons unrelated to driving risk — medical debt from a hospitalization, student loans in deferment, identity-theft damage, or simply being young and not yet having a deep credit file. These drivers pay substantially more for insurance despite having driving profiles indistinguishable from excellent-credit peers.
Territorial rating produces geographic discrimination that correlates with income and race in ways regulators in several states are actively examining. New Jersey, Michigan, and California have each pushed insurers to reduce reliance on ZIP code-only inputs, with mixed results. The practical impact on individual shoppers is that two drivers one block apart in opposite ZIP codes can pay very different premiums for identical risk.
UBI programs reward drivers who have the option to drive cautiously — those with short, consistent commutes in light-traffic areas — more than drivers who face the same real-world risk but have to accelerate harder or brake more sharply because of their traffic environment. A commuter navigating dense urban traffic may have objectively worse safety metrics than a rural driver without that being a reflection of skill or risk.
Vehicle-based rating relies on historical claim data, which means genuinely new vehicles (new model generations, new technology introductions) get rated on limited data in their first year or two. The Should You Trust Tech in First-Year Car Models article covers the related reliability question.
Understanding these limits doesn’t change the pricing, but it does help explain why premiums sometimes feel arbitrary — because for individual cases, parts of them are.
The Takeaway
Auto insurance pricing is less of a mystery than it feels. Insurers are estimating expected loss on a specific driver and specific vehicle in a specific place, using data that captures most of the relevant factors most of the time. The inputs break down into vehicle characteristics (make, model, theft rate, repair cost, loss history), driver characteristics (record, age, credit, claims history), location (ZIP code economics), coverage choices (deductibles, limits, which coverages to carry), and increasingly direct measurement of driving behavior through telematics.
For shoppers, the useful mental model is that half the premium is roughly locked in by things you cannot quickly change, and the other half is moveable through specific, well-understood actions: shopping around at renewal, bundling, optimizing deductibles, enrolling in a UBI program that fits your driving pattern, and over the longer term improving credit score and choosing vehicles with favorable loss histories. The 40%+ savings the ads advertise are real — but they almost always come from stacking several of these levers rather than finding one magic discount.
The telematics shift is the biggest change in rating in a decade, and it pulls insurance pricing closer to what it actually is: a bet on the specific person behind the wheel. For drivers who can demonstrate that bet is a good one, the savings are meaningful. For drivers who can’t — or who don’t want the surveillance — the traditional rating model will continue to serve as the alternative. Both will coexist for the foreseeable future.
External Sources
- NerdWallet — How Credit Score Affects Car Insurance
- LendingTree — Poor Credit Premiums Study
- The Zebra — Factors Affecting Car Insurance Rates
- Insurify — Usage-Based Insurance Programs 2026
- Insurify — Telematics Car Insurance 2026
- Insurify — State Farm Drive Safe & Save Review
- Bankrate — Usage-Based Insurance Explained
- CarPro — Top 10 Most Stolen Vehicles in the US 2025
- NICB — Vehicle Thefts Hit Lowest Level in Decades
- CarInsurance.com — Factors That Affect Car Insurance Rates
- HLDI — Highway Loss Data Institute
- MoneyGeek — Car Insurance Discounts
- Insurify — Most Stolen Cars in America 2025





























Leave a Reply
You must be logged in to post a comment.