


How Seasonality Affects Used Car Prices: The Buyer’s Guide to Timing the Market
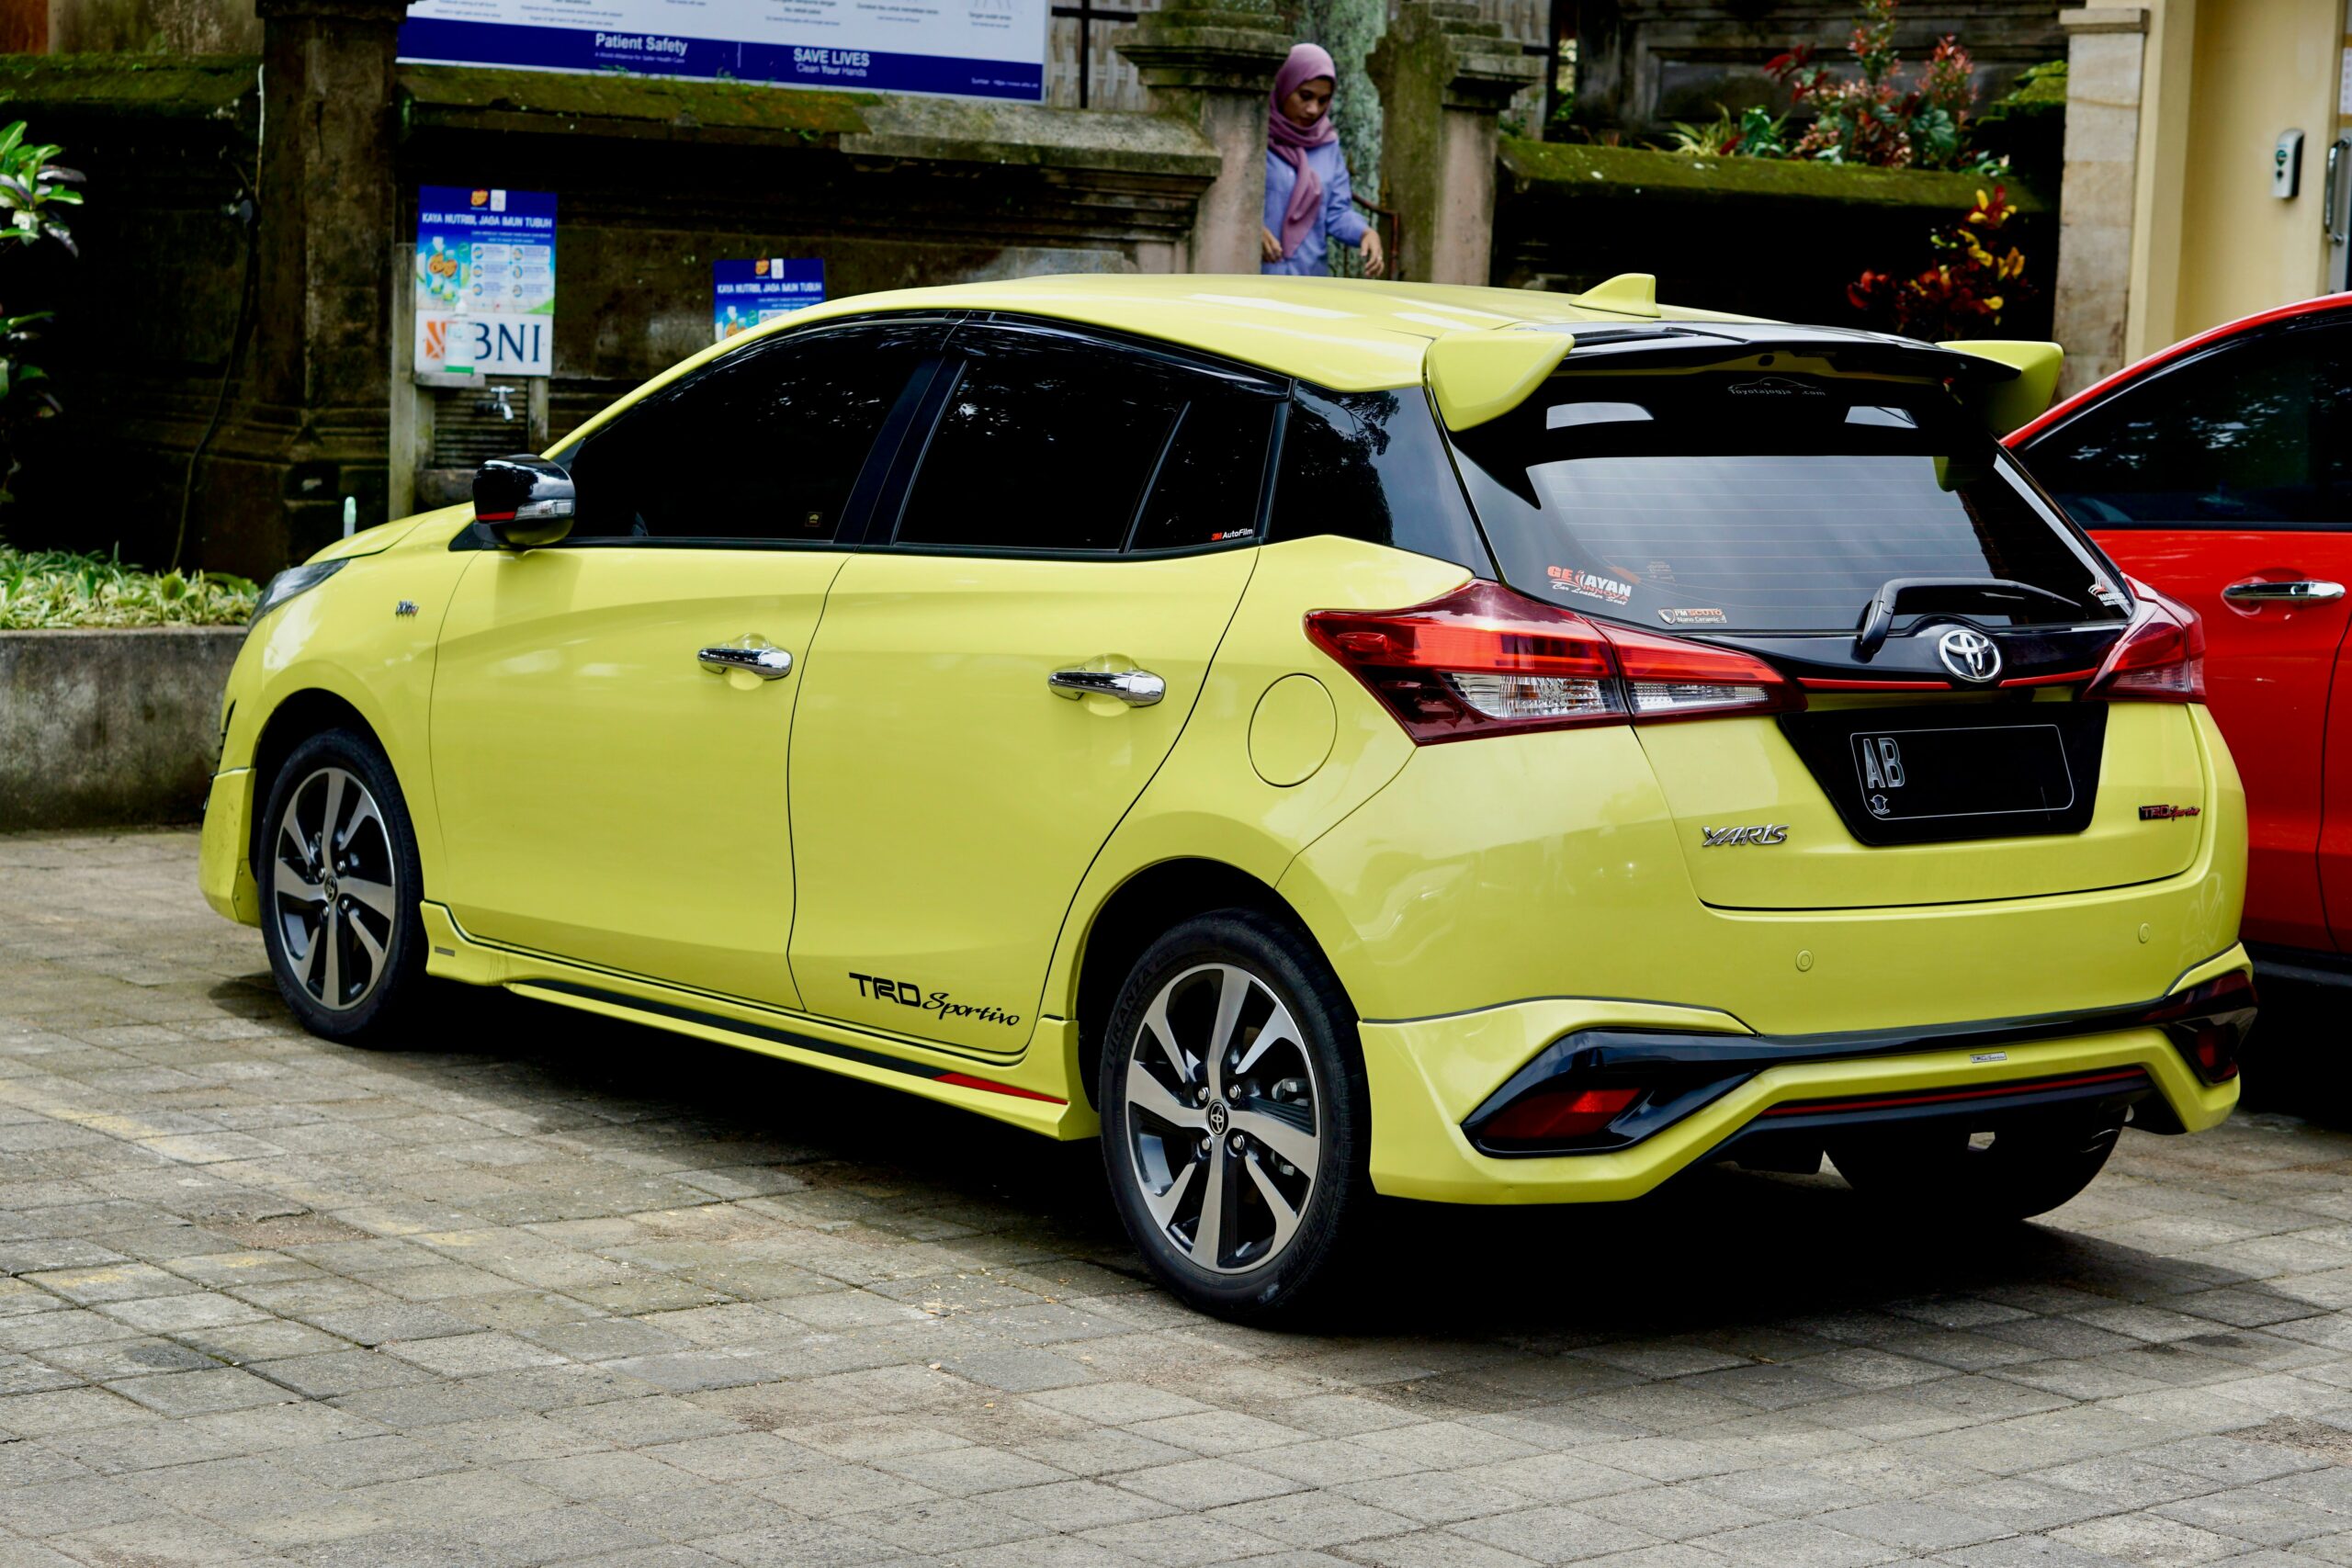
Most people walk onto a dealership lot whenever life forces them to — a totaled commute car, a growing family, a teenager with a license. That’s understandable, but it’s also the reason so many used-car buyers overpay. The same Toyota RAV4 that sells for $24,500 in March can sit on a different lot for $22,000 in November. Same trim. Same mileage. Same condition. Different month.
Used car prices follow a remarkably consistent annual cycle driven by tax refunds, dealer inventory mechanics, weather, and basic supply-and-demand psychology. If you can flex your timing by even a few months, the data shows you can save the equivalent of several years of insurance premiums. This guide breaks down what’s actually moving the market each season, what the real numbers look like, and how to time a purchase without waiting forever for a unicorn deal.
The Core Pattern: Prices Follow the Temperature
There’s a phrase used by Karl Brauer, an executive analyst at iSeeCars, that captures the seasonal cycle better than any chart: “used car prices follow the average temperature.” That’s not a metaphor — it’s a documented pattern visible across decades of transaction data.
When iSeeCars analyzed more than 40 million used car sales from 2024 and 2025, the seasonal effect was unmistakable. The average chance of finding a “good deal” — defined as a vehicle priced at least 10%, or roughly $2,689, below fair market value — sits at 13.7% on any given day. But that probability swings dramatically across the calendar.
January delivers 55.6% more good deals than the average day. February follows at +36.2%. December sits at +15.2%. Then the pattern flips: June, the worst month, shows 22.8% fewer good deals than average. May and July are nearly as bad. By the time tax-refund season is in full swing, you’re paying more for the same vehicle that would have been a bargain three months earlier.

That’s a dramatic spread for what many buyers assume is a relatively stable market. The mechanics behind it aren’t mysterious — they’re just rarely explained in one place.
Why the Cycle Exists: Three Forces, Working Together
Three structural factors create the seasonal pattern, and understanding them makes the timing strategy obvious rather than counterintuitive.
Tax refund cash floods the market in February through April. The IRS processes the bulk of refunds in the first quarter, with the average refund averaging in the low-to-mid $3,000 range in recent years. A meaningful percentage of those refunds get rolled directly into car down payments. CarGurus and Cox Automotive consistently flag late February through April as their highest-demand window, and dealers respond exactly the way you’d expect: list prices firm up, negotiating room shrinks, and lower-priced inventory clears in days rather than weeks.
Dealer inventory cycles peak in fall. Every December new-car sale generates a trade-in. Late December and January, used-car lots fill up with relatively recent trades — many of them clean, low-mileage, financed by the original owner for the previous three years. Combined with year-end manufacturer pressure on franchise dealers to hit annual targets, you get a rare moment where supply is high and motivation to move metal is even higher.
Weather suppresses winter demand. Foot traffic on dealer lots drops in cold-weather months. Buyers postpone non-urgent purchases. Test drives in sleet are nobody’s idea of a good Saturday. Dealers know this and price accordingly — not because they want to lose money, but because a vehicle sitting on the lot for 60+ days starts costing them in floor-plan financing interest. Moving inventory at a smaller margin beats holding it indefinitely.
The combined effect produces the seasonal cycle visible in every major used-vehicle pricing index.
What the Wholesale Data Shows
Retail listing prices are what consumers see, but they’re a lagging indicator. The leading indicator is the wholesale market — the auctions where dealers acquire inventory. Cox Automotive’s Manheim Used Vehicle Value Index tracks wholesale used-vehicle prices, and CarGurus publishes a parallel Used Vehicle Demand Index tracking retail demand. Both reveal the same recurring shape across years: a tax-season peak, a long descent through summer, and a trough between August and October.

The magnitude of the cycle varies year to year — supply shocks like the 2021 chip shortage temporarily inverted normal patterns, and tariff uncertainty in 2025 drove an unusual spring rally in used pricing per Jalopnik’s coverage of CarGurus data. But the directional pattern is so consistent that wholesalers, lenders, and remarketers build it into their forecasts. As of October 2025, Black Book reported wholesale used prices had fallen for 25 consecutive weeks, tracking the typical autumn decline almost on schedule.
For a buyer, the practical implication is simple: the wholesale price the dealer paid two months ago is reflected in today’s lot price. When you shop in October and November, you’re benefiting from the August–September trough that dealers acquired inventory through. When you shop in March, you’re paying for inventory dealers bought during the February buying frenzy.
Body Style Matters More Than Most Buyers Realize
The general monthly pattern applies to the whole used market, but it gets sharper when you account for body style. Demand isn’t uniform — it shifts dramatically with weather and lifestyle.

The clearest example is the convertible. A 2021 Mazda MX-5 Miata or Ford Mustang convertible commands meaningfully more money in May than it does in December. Buyers picture themselves with the top down on a sunny day in spring, not white-knuckling an icy on-ramp in February. If you want a convertible, shop for one in January. The supply is the same; the buyer pool is a fraction of summer’s.
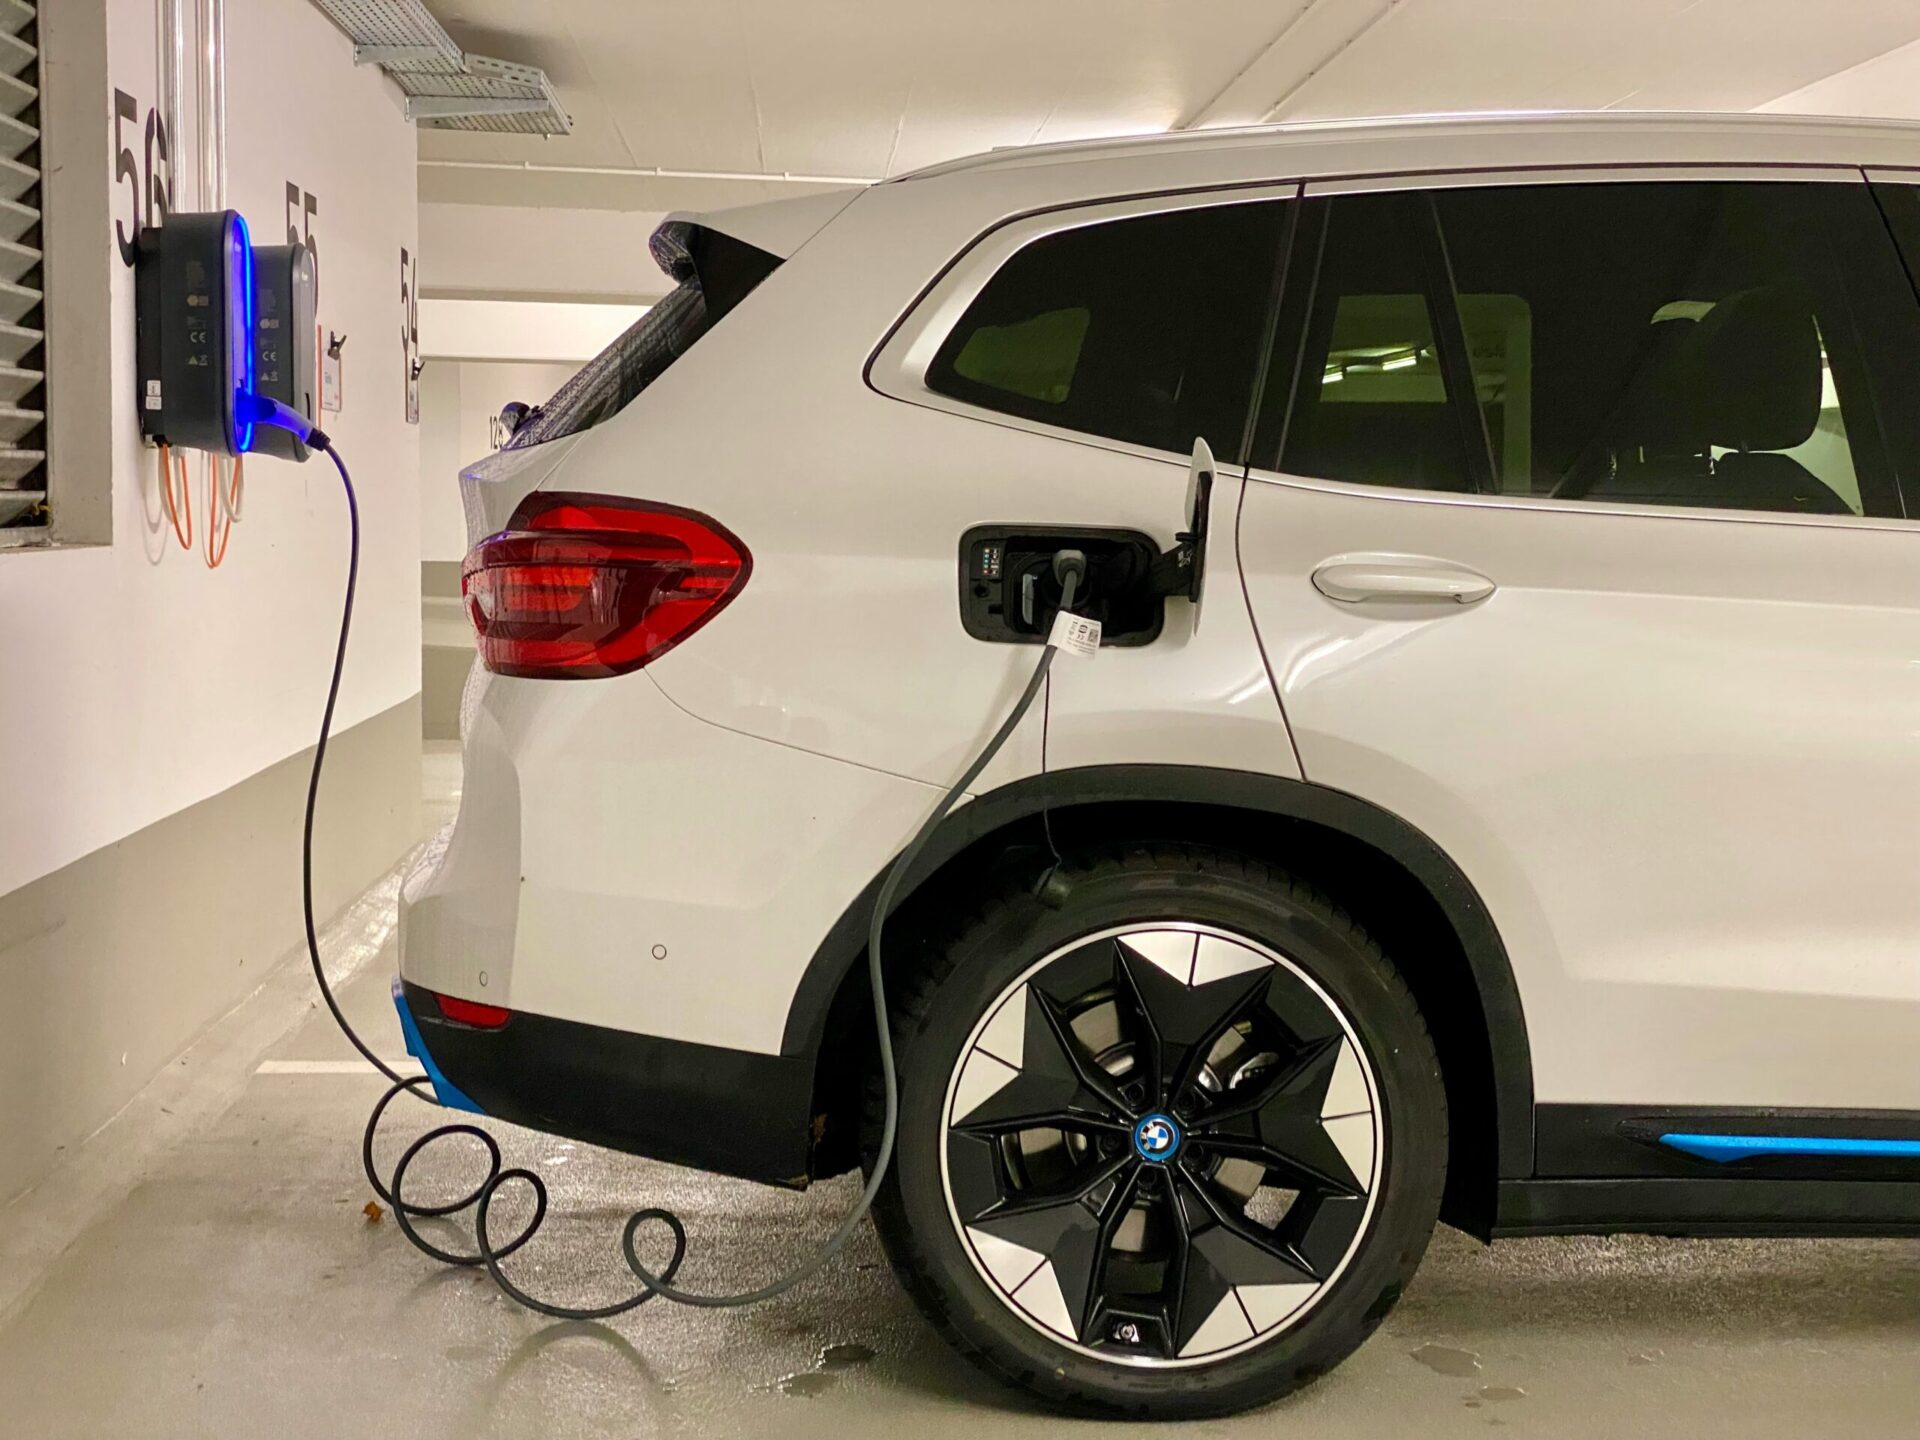
The pattern flips for SUVs and AWD vehicles. Subaru Outbacks and Foresters, Toyota RAV4s, Honda CR-Vs, and the AWD trims of vehicles like the BMW X3 or Mercedes-Benz GLC see their strongest demand in late fall and winter, when the first snowstorm reminds people why they wanted four driven wheels in the first place. Shop for a used Subaru in July. Shop for a used Mustang in January. Both go against everyone’s intuition, which is precisely why they work.
Pickup trucks behave more like SUVs but with regional variation — strong winter demand in the Midwest and Mountain West, more even distribution in the South and Southwest. Sedans, increasingly the orphans of the new-car market, show the flattest seasonal curve, but you’ll still pay slightly less for a Honda Civic or Toyota Camry in November than in March.
Fuel price shocks layer on top of these seasonal patterns — when gas spikes mid-year (like the 2026 Iran/Strait of Hormuz crisis), demand for fuel-efficient sedans and hybrids surges regardless of season, while gas-thirsty SUVs and pickups face extra downward pressure. See how fuel prices affect car ownership for how the current crisis is reshaping segment-level used pricing.
This is also where regional context matters. A used SUV that lived its life in the Northeast or Great Lakes will have more salt exposure than a counterpart from Arizona or Texas. We covered this in detail in our used car reliability by region guide — buying off-season is even more powerful when paired with sourcing from the right region.
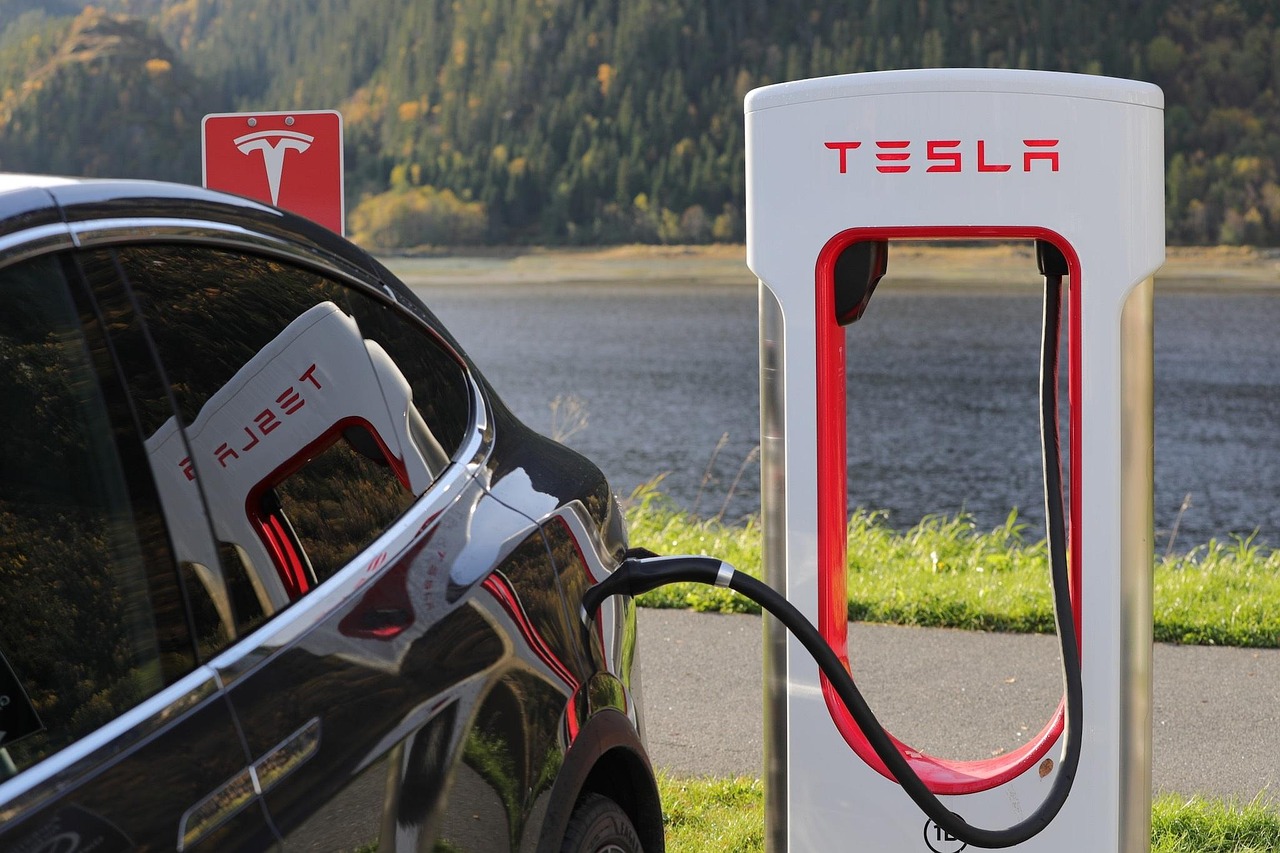
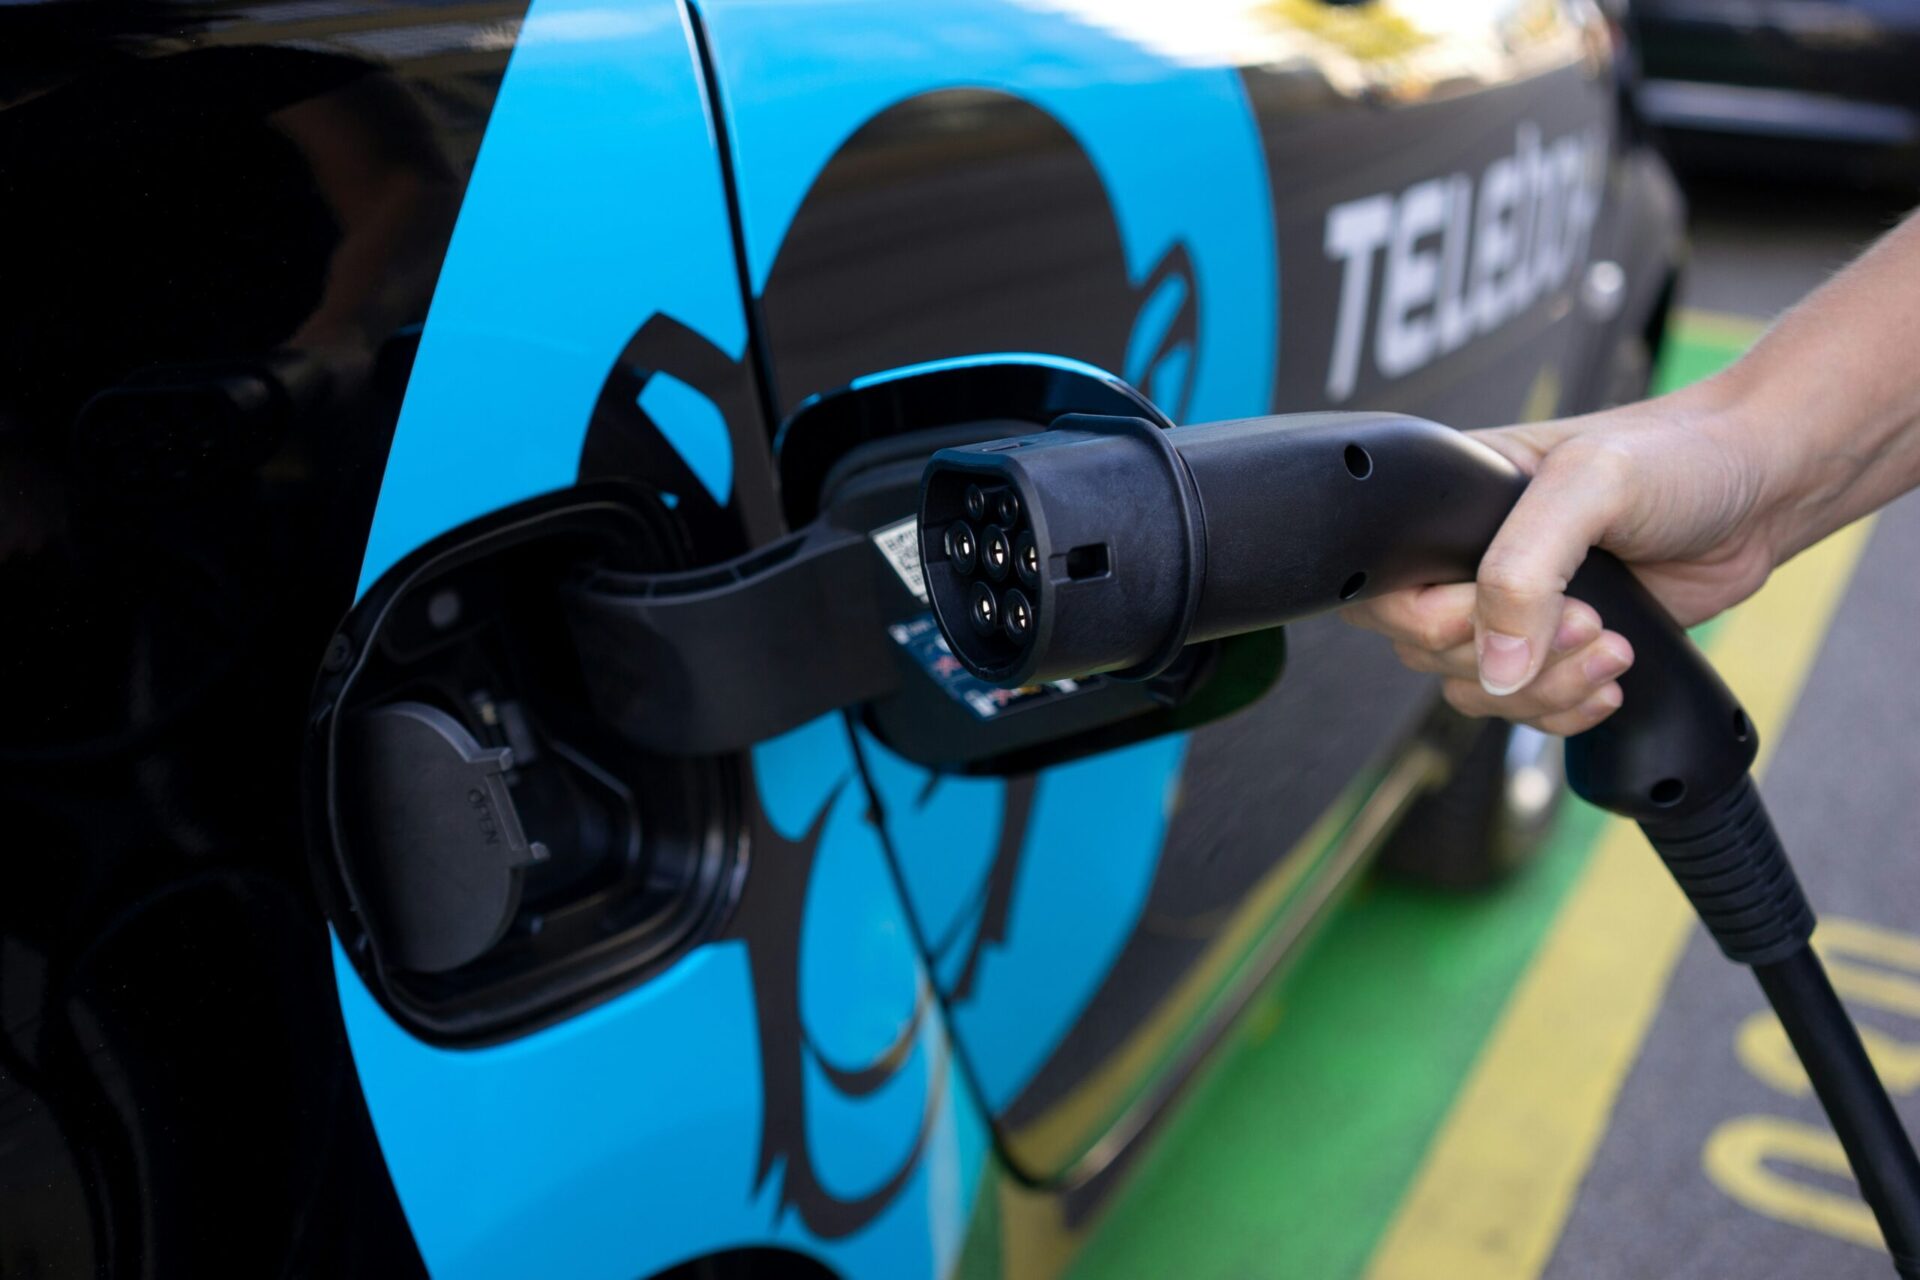
The Tesla and Used EV Wrinkle
Used EV pricing has its own dynamics that overlap with — but don’t fully match — the seasonal cycle for traditional cars. Used EV values dropped roughly 47% from their June 2022 peaks per iSeeCars data, driven by a flood of fleet returns, aggressive new-car price cuts (especially from Tesla), and improving battery technology making older EVs feel comparatively dated.
Tesla pricing illustrates the pattern. The Model Y and Model 3 saw substantial used-price declines in 2023 and 2024 as Tesla repeatedly cut new-car MSRPs — every new-car cut compresses used values immediately. By 2025, the rate of decline had slowed dramatically. Used Model 3 and Model Y values were roughly flat to down 1–2% year-over-year in early 2025, while traditional used cars were rising 3–5% over the same period.
For seasonal timing on used Teslas, a few EV-specific factors matter alongside the general winter-low/summer-high pattern:
- Range and cold weather. Buyers who plan a road trip in summer often shop in spring, lifting EV demand. Cold-climate buyers may hesitate on a winter purchase precisely because extreme temperatures affect EV battery performance more than gas vehicles. The result: late winter and very early spring can produce surprisingly strong deals on used EVs from snow-belt sellers.
- New-car incentive cycles. Tesla’s quarterly delivery push at the end of March, June, September, and December creates downward pressure on used Tesla pricing in the days following each quarter-end. A used 2022 Model Y on a dealer’s lot competes with a brand-new one being discounted for delivery.
- Other brands. Hyundai’s Ioniq 5 and Ioniq 6, Ford’s Mustang Mach-E, and Rivian’s R1S and R1T all follow similar patterns, though Rivian’s used inventory remains thin given the brand’s relative youth. BYD models are referenced internationally but remain unavailable in the U.S. market.
EV shoppers should pair seasonal timing with sourcing diligence. A used EV from a hot-climate state may have measurably more battery degradation than the same model from a milder region — independent of when you buy.
The Holidays That Actually Matter
The iSeeCars study quantified specific holidays, and the results don’t always match advertising. Three holidays consistently outperform every other day of the year:
Martin Luther King Jr. Day ranks as the single best day, with 65.5% more good deals than an average day. It falls in mid-January when dealer foot traffic is at its annual low, manufacturer incentives reset, and lots are full of December trade-ins. New Year’s Eve and New Year’s Day show 58.6% more deals — partly year-end inventory clearance, partly buyers prioritizing other things on those days. Presidents’ Day in February delivers around 47% more good deals than average, often paired with manufacturer-backed incentives on slower-moving models.
The holidays advertised most aggressively for car sales — Memorial Day, Fourth of July, Labor Day — tell a more complicated story for used cars. Memorial Day and July 4th actually show fewer used-car deals than average (by 18% and 22.4% respectively), despite the marketing. The reasoning is straightforward: dealers don’t need to discount when demand is already high. Labor Day is more genuinely a sale event because it doubles as new-car model-year clearance, which can spill over to used inventory.
If you’re committed to shopping a holiday weekend, make it MLK Day, New Year’s Eve/Day, or the post-Christmas week. Skip Memorial Day unless you’ve already done your homework and know the specific car you’re targeting is genuinely discounted.
How Depreciation and Seasonality Interact
Seasonal pricing sits on top of, not separate from, the depreciation curve a vehicle is already traveling. A 2022 vehicle priced today is dropping in value due to age regardless of season. The seasonal effect is a temporary discount or premium overlaid on that longer trend, which we’ve broken down in detail in our analysis of how new cars depreciate over time.
This matters for timing in two ways.
First, the steepest depreciation happens in the first three years. A vehicle sold in November of year three is meaningfully cheaper than the same vehicle sold in November of year two — not because of seasonality, but because it just crossed a depreciation threshold. Combining the depreciation cliff with off-season timing produces the strongest savings.
Second, depreciation slows after years 5–7 even as maintenance costs accelerate. For older used vehicles, the seasonal premium becomes a smaller percentage of the total price, but the maintenance side gets larger. Our coverage of the hidden costs of owning an older vehicle covers the maintenance curve in depth — it’s the other side of the savings equation.
The ideal target for most buyers is a vehicle 3–5 years old, purchased in November through February, sourced from a region without heavy salt exposure. That combination consistently produces the best price-per-mile-of-remaining-life across mainstream brands like Toyota, Honda, Hyundai, and Lexus.
Practical Strategy for Buyers
Translating the seasonal pattern into actual savings comes down to a few disciplined moves.
Start watching prices three months before you actually need to buy. Use the iSeeCars VIN check tool, Kelley Blue Book, and Carfax to track the specific year, make, and trim you want. Watching the price for 90 days teaches you what “fair” looks like for that vehicle. Without that baseline, every “deal” looks like a deal.
Avoid the March–July window unless you have to. Tax refund demand combined with summer foot traffic produces the year’s worst price environment. If you must buy in this window, expect to negotiate harder and walk away from more cars to find one priced reasonably.
Target end-of-month and end-of-quarter. The last three to five days of a month create real urgency for sales staff approaching their quotas, and end-of-quarter months (March, June, September, December) carry additional pressure on franchise dealers from manufacturers. Combining off-season timing with end-of-month visits compounds the leverage.
Don’t ignore the trim and option mix. A common mistake is fixating on the lowest sticker. A higher trim with safety tech may sell for marginally more but hold value better and require fewer add-ons later. Our trim level pricing vs. feature value breakdown covers when stretching for the higher trim is worth it.
Verify the deal is real. A November price that looks like a steal might just reflect normal seasonality, not unusual generosity from the dealer. The reverse is also true — a March price that seems fair might be 6–8% above what the same car would cost in October. Compare against the seasonal baseline, not against the dealer’s “original” sticker.
Factor financing separately. A dealer eager to move inventory may offer a strong price on the vehicle but make it back on finance terms. Always run the numbers on total cost of ownership, including financing — and consider how trade-in dynamics affect the equation. See our deep dive on how trade-in equity affects loan decisions.
The way you finance the purchase matters as much as the price you pay. See our breakdown of how loan terms affect total cost of ownership — APR, term length, and lender choice can swing the lifetime cost of the same vehicle by $10,000 or more.
When the Pattern Doesn’t Hold
The seasonal cycle is robust but not absolute. A few situations override it.
Supply shocks. The 2021 chip shortage and 2022 used-car price spike completely scrambled normal seasonality, with prices rising in months that should have seen declines. Tariff uncertainty in 2025 produced similar distortions, with used prices rising into spring rather than peaking and declining per coverage of the unusual cycle. When supply tightens unusually, seasonal advantages compress.
Specific high-demand vehicles. Vehicles with cult followings or persistent shortages — certain Toyota Tacomas, Honda Civic Type Rs, low-mileage Lexus models — barely follow seasonal patterns. Demand is structural, not seasonal. The same is increasingly true for hybrid models from Toyota and Honda, where waiting lists on new versions push demand into the used market year-round.
Regional variation. A Subaru Outback may peak in October in Vermont but show a flatter curve in Florida, where AWD demand is muted. Truck demand is stronger in Texas and the Mountain West than on either coast. National data points the right direction; local market conditions modify the magnitude.
Interest-rate environment. When rates are rising, monthly payment becomes the binding constraint for many buyers, and the demand calendar gets compressed. When rates are falling, demand pulls forward and seasonal troughs become shallower. Keep an eye on the Federal Reserve’s posture alongside the calendar.
Bottom Line
Used car pricing follows a predictable annual cycle that’s been documented across millions of transactions and decades of wholesale data. The colder months — November through February — consistently produce the best opportunities for buyers, with January and February being the strongest windows. Spring through mid-summer is the worst time to buy, despite the marketing that says otherwise.
The smart move isn’t to wait forever for a perfect deal. It’s to start watching three months before you need a car, time the actual purchase to a slow month, target end-of-month and end-of-quarter pressure, and pair off-season timing with sound choices on body style, region, and trim. A buyer who does this consistently saves enough across a vehicle’s ownership cycle to fund a meaningful portion of the next car. A buyer who shows up at a lot in June, financially urgent and weather-cheerful, almost always pays for the privilege.
Timing won’t fix every aspect of car buying. It won’t make a bad vehicle reliable, won’t undo a poor financing decision, and won’t compensate for skipping a pre-purchase inspection. But it does shift the math by thousands of dollars on most transactions — and that’s worth paying attention to.
Sources and Further Reading
- iSeeCars — The 10 Best and 10 Worst Times To Buy a Used Car
- iSeeCars — Used Car Prices Study (Tesla and EV pricing trends)
- Cox Automotive — Manheim Used Vehicle Value Index
- CarGurus — Used Car Price Trends and Demand Index
- CarEdge — Used Car Price Trends 2025 (Black Book wholesale data)
- Jalopnik — Used Car Prices and the 2025 Tariff Effect
- Detroit News — Used Cars Are Having a Moment as New Vehicle Costs Rise
- Consumer Affairs — When Is the Best Time to Buy a Used Car?
- Federal Highway Administration — Average Annual Miles Driven
- IRS — Filing Season Statistics and Average Refund Data
- Kelley Blue Book — Used Car Values
- Carfax — Vehicle History Reports
- Edmunds — Used Vehicle Market Reports


Leave a Reply
You must be logged in to post a comment.