


Ten weeks ago, the average American driver was paying $2.98 for a gallon of regular gasoline. Today, that same gallon costs $4.23. The increase — $1.25 per gallon, or 44% — has happened almost entirely since late February 2026, when the war between Iran and the U.S.-Israel coalition closed the Strait of Hormuz to most oil shipping. For a household that fills up twice a week, that’s roughly $40 a week in additional spending — over $2,000 a year — going to one line item on the household budget.
The Strait of Hormuz handles approximately 20% of global oil flow. When ship traffic through it drops to single digits per day — as it has since the war began — there is no replacement supply at scale. The International Energy Agency has called the disruption the largest supply disruption in the history of the global oil market. The April 8 ceasefire announced between the U.S. and Iran did not reopen the Strait, and at the time of writing (late April 2026), Brent crude has briefly touched $126 per barrel — its highest level in four years.
This isn’t an article about geopolitics. There are better places to read about the war, the negotiations, and what may or may not happen next. This is an article about what fuel prices mean for car ownership in the U.S. — what they’re costing you right now, what could happen next, and how the structural decisions you make about your vehicle, driving habits, and household transportation can insulate you from this crisis and the next one.
What’s Actually Happening at the Pump
The 2026 spike has been faster and broader than most consumers realize. AAA’s national daily average — the most widely cited gas-price benchmark — sat at roughly $2.98 in mid-February. By April 30, it hit $4.30, a fresh four-year high. Some markets are dramatically higher: California stations were reportedly listing prices over $8 per gallon in late April, with the state average sitting around $5.89.

The trajectory matters. Unlike the 2022 spike — which followed Russia’s invasion of Ukraine and topped out at $5.01 nationally before easing — the 2026 crisis is still unfolding. Analysts have warned that if the Strait of Hormuz remains effectively closed, the U.S. national average could climb to $5.00 per gallon. The chart above shows the weekly progression since the war began, including the brief decline after the April 8 ceasefire and the renewed climb that followed when the strait did not actually reopen.
A few features of this crisis worth understanding:
It’s a supply shock, not a demand spike. Unlike 2008, when global demand outran production, this is a situation where existing supply has been physically disrupted. That makes it more responsive to political events than to economic ones — a single development in the Middle East can move prices several percent in a single trading session.
The U.S. produces a lot of oil but still imports. America is the world’s largest oil producer, but U.S. refineries process a mix of crude grades, and many require imported heavy crude that’s traditionally come through the Persian Gulf. Gas prices are set by global markets, not domestic production alone.
Refining capacity adds another layer. NBC reported that the surge has been compounded by the typical price increases seen this time of year as refineries undergo spring maintenance and switch to summer-blend gasoline. The crisis hit at the worst possible seasonal moment.
Other fuel-dependent costs are rising too. Jet fuel has spiked 95% since the war began, leading airlines to raise baggage fees. The U.S. Postal Service, Amazon, and FedEx have all implemented fuel surcharges. If you’ve noticed online order shipping costs creeping up, that’s why.
What This Costs You Per Year
The dollar impact depends almost entirely on what you drive and how much you drive it. The Federal Highway Administration’s average is 13,500 miles per year per driver. At that mileage, the difference between pre-war and current pricing is substantial — and the difference between current pricing and the worst-case forecast is nearly as large.

A few takeaways from the math:
Fuel-efficient vehicles save real money in absolute dollars during a crisis. A Honda Civic or Toyota Corolla driver at 35 MPG spends $1,632 annually at current prices. A Ford F-150 driver at 20 MPG spends $2,855 — over $1,200 more. At the worst-case $5 forecast, the gap widens to nearly $1,500 per year for the same 13,500 miles.
The hybrid premium pays off fastest in price spikes like this. A Toyota Camry Hybrid or RAV4 Hybrid at 48 MPG combined spends roughly $1,190 annually at current gas prices. That’s $850–$1,200 less than the gas-only equivalent vehicles. Hybrid premiums on new cars typically run $1,500–$3,500 over the standard powertrain — meaning the payback window during a fuel crisis can be as short as 18–24 months.
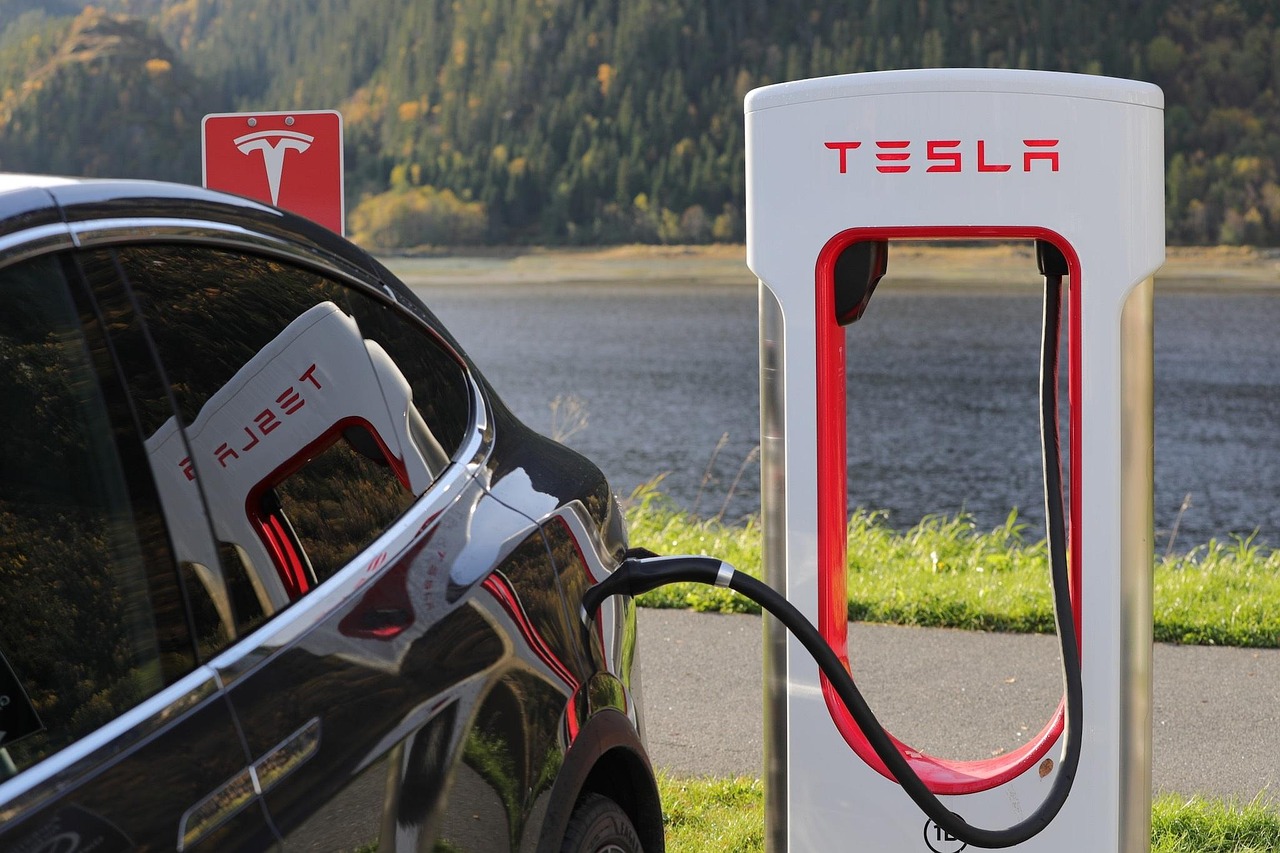
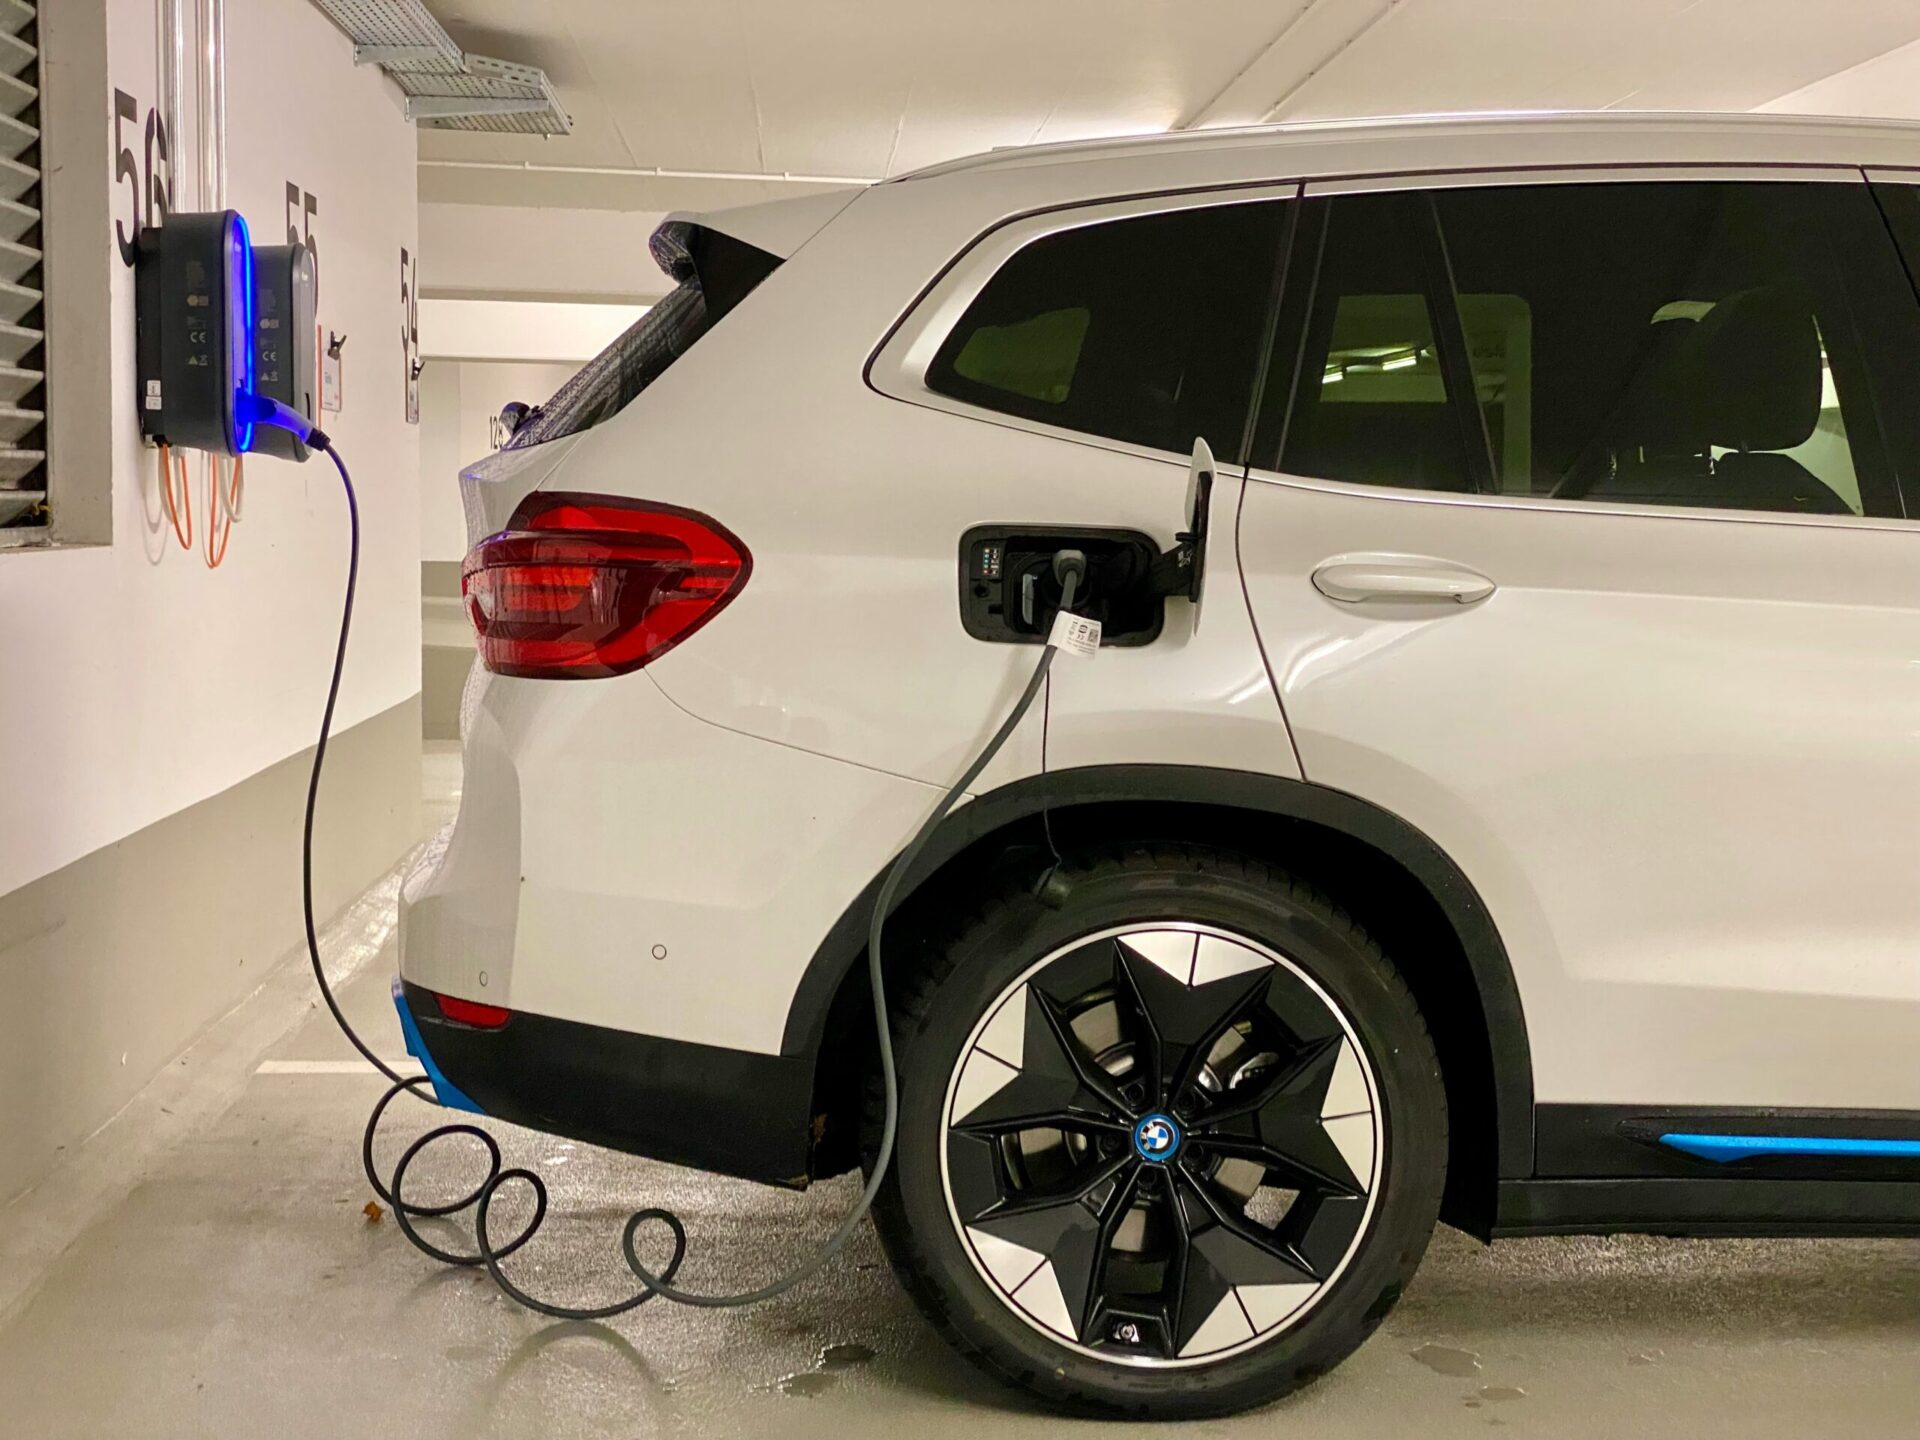
EVs at home charging are largely insulated from the spike. A typical EV at 3.5 miles per kWh and the U.S. residential electricity average of $0.158/kWh costs roughly $609 per year for the same 13,500 miles. That’s because U.S. residential electricity is generated almost entirely from domestic natural gas, nuclear, coal, and renewables — none of which pass through the Strait of Hormuz. As Electrek noted, Edmunds data showed electrified-vehicle consideration jumping to 23.8% of all car shopper research activity by mid-March, the highest weekly level of 2026.
High-mileage drivers feel everything more. A 25,000-mile-per-year sales rep, contractor, or commuter pays roughly twice what the FHWA-average driver pays. Annual fuel costs for a high-mileage F-150 driver at current prices: $5,300. At $5/gallon: $6,250.
This Has Happened Before — and Will Again
It’s worth zooming out. The 2026 Iran/Hormuz crisis is the third major fuel price shock in 18 years.

The 2008 crisis was demand-driven — surging global consumption ran into stagnant production. Gas hit $4.05 nationally in July 2008, up 76% from baseline. It took a global recession to break the cycle.
The 2022 crisis was triggered by Russia’s invasion of Ukraine. Gas hit a record $5.01 in June 2022, up 46% from pre-war levels. Pandemic-era supply constraints amplified the impact. Prices declined gradually through 2023 but never fully returned to pre-pandemic levels.
The 2026 crisis is supply-driven again, this time by a physical chokepoint closure rather than sanctions or supply chain stress. Current peak: $4.30, up 44% from pre-war baseline — and analysts warn the peak isn’t necessarily in.
Each crisis has played out differently, but the pattern for car owners is consistent: the people who suffered most were those locked into high-fuel-cost decisions. Those who had flexibility — fuel-efficient daily drivers, alternatives to long commutes, ability to consolidate trips — adjusted with less pain. Those committed to gas-guzzling vehicles, long commutes, or rigid driving routines absorbed the full impact.
This pattern matters because there will be a fourth crisis, and a fifth. The decisions you make today about your vehicle and your transportation lifestyle will determine how much pain the next one causes you.
How Vehicle Choice Changes Everything
The single largest factor in your fuel exposure isn’t gas prices — it’s the vehicle you chose to buy. A 2024 Toyota RAV4 Hybrid owner is paying half what a 2024 Chevrolet Tahoe owner is paying for the same number of miles, every month, in every fuel-price environment. That gap doesn’t go away when prices come down; it just becomes smaller in absolute terms.
When fuel prices are stable, this gap is easy to ignore. When they’re spiking, it becomes the dominant variable in household transportation costs. Several brand and model choices stand out for their fuel-cost insulation:
Toyota’s hybrid lineup is the deepest in the industry. The Prius, Camry Hybrid, Corolla Hybrid, RAV4 Hybrid, Highlander Hybrid, and Crown all deliver 38–57 MPG combined. The hybrid versions of the RAV4 and Camry have become particularly popular — they cost $1,500–$3,000 more than the gas versions but recover that premium in 2–3 years at current prices.
Honda hybrids include the Accord Hybrid, CR-V Hybrid, and Civic Hybrid. Combined MPG ratings of 37–50 put them firmly in the fuel-cost-resistant category. Honda has steadily added hybrid options across its lineup over the past three years.
Hyundai and Kia hybrids — Tucson Hybrid, Sportage Hybrid, Sorento Hybrid, Elantra Hybrid — deliver similar efficiency at competitive prices. Hyundai’s Ioniq lineup includes both hybrid and full EV options.
Tesla, Hyundai Ioniq 5/6, Ford Mustang Mach-E, and Rivian R1S/R1T are among the most popular EV options for buyers wanting to step out of the gas price cycle entirely. As covered earlier, home charging insulates EV drivers almost completely from oil price shocks — a key advantage that’s never more visible than during a crisis like this one. (BYD makes some of the most cost-competitive EVs globally but remains unavailable in the U.S. market.)
Subaru offers fewer hybrid options, but the Crosstrek Hybrid and standard non-hybrid Subarus deliver respectable 28–34 MPG combined, particularly attractive for buyers in cold-climate regions where the brand’s standard AWD justifies the modest fuel-economy trade-off.
Pickup trucks and large SUVs are the most fuel-exposed segment. F-150, Silverado, Tahoe, Suburban, and Expedition typically rate 17–22 MPG combined. There are partial fixes — Ford’s F-150 PowerBoost Hybrid (24 MPG combined), the F-150 Lightning EV, and Toyota’s Tundra Hybrid — but the segment as a whole is structurally exposed to oil prices in a way smaller vehicles aren’t.
Luxury European models are mixed. BMW’s hybrid options (X3 xDrive30e, X5 xDrive50e) are competitive. Mercedes-Benz hybrids similar. But the gas-only V8 trims of these brands are among the most fuel-exposed vehicles on the road.
If you’re shopping for your next vehicle in this environment, the fuel-economy line on the window sticker has become a much more important number than it was 90 days ago. Our breakdown of trim level pricing vs. feature value covers how to weigh hybrid premiums against other trim decisions, and our coverage of how new cars depreciate over time includes how fuel prices affect resale value across segments.
The Two-Vehicle Household Calculus
Multi-vehicle households have an option single-vehicle households don’t: shifting which vehicle gets used for which trips. The right strategy can reduce fuel costs significantly without any new vehicle purchase.
The basic logic is straightforward — if your household has both an F-150 and a Camry, every commute mile driven in the Camry instead of the F-150 saves roughly 30% on fuel. Across 12,000 commute miles per year, that’s $700–$1,000 in real savings at current prices. The F-150 stays available for trips that genuinely require it (towing, hauling, bad-weather access) but stops being the default daily driver.
For households considering buying a second vehicle, the math gets even more interesting in a high-fuel-price environment. A used Honda Civic, Toyota Corolla, or Hyundai Elantra purchased for $14,000–$18,000 can pay for itself in fuel savings within 4–6 years if it replaces 10,000+ commute miles in a less-efficient vehicle. The savings compound when fuel prices are elevated. (See our breakdown of how seasonality affects used car prices for the best windows to buy a fuel-efficient second vehicle.)
The catch: each additional vehicle adds insurance, registration, and maintenance overhead. Running the numbers honestly — including all costs, not just fuel — is essential before adding a second vehicle. Households driving fewer than 8,000 miles per year on a less-efficient primary vehicle rarely benefit; households at 15,000+ miles often do.
Maintenance and Driving Habits Matter More When Gas Is Expensive
The same vehicle, driven the same number of miles, can deliver dramatically different real-world fuel economy depending on how it’s maintained and driven. In a crisis-pricing environment, these differences translate to real money.
Tire pressure is the most underappreciated fuel-economy factor. The U.S. Department of Energy estimates underinflated tires reduce fuel economy by about 0.2% per 1 PSI below recommended pressure. A 5-PSI underinflation is common and costs roughly 1% in MPG — meaningful at $4+ gas. Check tire pressure monthly, especially as ambient temperature changes.
Engine air filters and oil affect efficiency, particularly on older vehicles. A clogged air filter on a fuel-injected engine has minor impact on MPG (a few percent at most), but worn spark plugs, dirty fuel injectors, and degraded oxygen sensors can reduce efficiency by 5–10%. If your check-engine light is on, fix it; modern OBD-II systems often signal small efficiency-killing problems before they become drivability issues.
Aggressive driving costs the most. DOE data puts the MPG penalty for aggressive driving (rapid acceleration, hard braking, high-speed cruising) at 15–30% in city driving and 10–40% on highways. At $4.23/gallon and 13,500 miles per year, smoothing your driving style can save $200–$600 annually on the same vehicle.
Highway speed matters disproportionately. Most vehicles peak in efficiency around 50–55 MPH. Above 60 MPH, every additional 5 MPH costs roughly 7% in fuel economy. Cruising at 75 instead of 65 on a 200-mile trip can cost $4–$6 in extra fuel — small per trip, but it adds up across a year.
Idling is pure waste. Modern engines need essentially no warm-up time and lose 1/4 to 1/2 gallon per hour of idling. If you’re sitting in a drive-through line for more than 30 seconds, turning the engine off is genuinely worth it.
These changes aren’t dramatic individually, but combined they can deliver 10–20% improvement in real-world fuel economy on the same vehicle. At current prices, that’s the difference between $2,000 and $1,700 in annual fuel costs for an average driver.
Other Costs Triggered by High Fuel Prices
Fuel prices don’t move in isolation. When gas spikes, other car-ownership costs typically follow:
Insurance can rise as more drivers file claims and as the cost of replacement parts (which require shipping fuel) increases. Auto insurance premiums have been rising regardless of fuel prices, but high fuel prices accelerate the trend.
Fuel is one component of the broader ownership cost picture — see our pillar guide on total cost of ownership beyond the purchase price for how fuel, insurance, depreciation, financing, and maintenance combine into the real cost of any vehicle.
Maintenance and repair costs rise as parts shipping and labor rates respond to broader inflation. Independent shops and dealerships both pass along their cost increases.
Used car values can shift dramatically. As Electrek reported, online searches for EVs surged 17% in a single week as gas prices spiked. Demand-driven shifts mean fuel-efficient used cars get expensive fast in crisis pricing — a 2-year-old Toyota Prius or Honda Civic Hybrid can command thousands above book value during fuel crises. Conversely, large gas SUVs and trucks see their used values pressured downward.
New car incentive programs sometimes adjust to reflect the environment. Manufacturers may pull incentives on fuel-efficient vehicles (high demand, no need to discount) and add incentives on less-efficient models (slowing demand). The new-car-buying calculus during a fuel crisis is genuinely different from the calculus during stable pricing.
Trade-in values shift accordingly. A buyer trying to get out of a gas-guzzling vehicle during a crisis often takes a worse trade-in offer than they would have six months earlier. Our deeper coverage of this dynamic is in how trade-in equity affects loan decisions.
Long-Term Strategy: How to Insulate Yourself from the Next Crisis
Fuel price crises are recurring features of car ownership in the United States, not exceptions. The 2008, 2022, and 2026 spikes all came from different underlying causes but produced similar effects at the pump. Several long-term decisions can reduce your exposure to whatever causes the next one.
Choose vehicles with fuel cost in mind, not just sticker price. A $30,000 hybrid that costs $1,200/year less to fuel than a $28,000 gas equivalent recovers its $2,000 premium in under two years, and saves you money for the next decade. Run this math before you buy.
Prioritize EVs if you have home charging. EV ownership economics have shifted dramatically in 2026. With current gas prices and the federal tax credit, the break-even window between an EV and a comparable gas car has compressed to 2–4 years for most mainstream buyers. Once you cross that line, every year is pure savings — and importantly, you’ve stepped out of the oil price cycle entirely.
Live closer to work, or work closer to home. Commute distance is the single largest determinant of household fuel consumption for most Americans. A 15-mile commute and a 35-mile commute look identical on a map but produce roughly 3x the lifetime fuel cost. Geographic decisions made over years (where you live, where you take a job) matter more than what you drive.
Pay down auto loan debt aggressively. Drivers in long auto loans with high fuel costs have less flexibility — they can’t easily switch vehicles without rolling negative equity into the next loan. Our loan terms breakdown covers why this matters more in unstable economic environments.
Build a fuel-cost cushion in your monthly budget. A household assuming gas at $3 might struggle when it’s $4.30. A household assuming $4.50 has automatic margin built in. The realistic way to budget for fuel is to assume something close to the historical peak rather than the historical average — that way, when prices spike, you don’t break.
Use fuel-tracking tools. Apps like GasBuddy and AAA’s price-locator help find the lowest local prices, often saving $0.10–$0.30 per gallon. On 13,500 miles per year at 25 MPG, even $0.15/gallon savings = $80 per year. Combined with the U.S. Department of Energy’s Vehicle Cost Calculator, you can build a realistic picture of total fuel costs across vehicle options.
Consider alternatives where they fit. Public transit, biking, e-bikes, carpools, and ride-sharing services aren’t realistic for everyone, but they can be realistic for some trips even when you own a vehicle. Households that successfully reduce miles driven by 20% see their fuel costs drop 20% — independent of what gas prices do.
The Bigger Picture
It’s worth saying clearly: the 2026 crisis is not the end of cheap fuel forever, and it’s not the beginning of permanent $5 gas. Crises end. The Strait of Hormuz will reopen — through diplomacy, military action, or simple time. Brent crude will fall back from $115. AAA’s national average will eventually drop from $4.23, perhaps to $3.50, perhaps lower. The 2008 and 2022 spikes both followed this pattern.
But what fuel crises do permanently change is the cost basis for everything in the auto industry — vehicle prices, maintenance, insurance, used-car values, lender expectations. The “normal” gas price after 2026 will probably be higher than the “normal” before 2026, just as post-2022 normal was higher than post-2008 normal. The pattern over decades is unmistakable: every fuel crisis raises the floor.
That makes long-term decisions about fuel exposure more important, not less. Buyers who treat each crisis as a one-time event and revert to old habits when prices fall pay full freight every time. Buyers who use crises as forcing functions to upgrade fuel efficiency, change commuting patterns, or transition to electrified vehicles end up with structurally lower transportation costs across the rest of their driving lives.
The current crisis is real, and the pain at the pump is real. But the more useful question for car owners isn’t “when will gas come back down?” — it’s “what choices am I making today that determine how much the next crisis costs me?”
Sources and Further Reading
Federal Highway Administration — Average Annual Miles Per Driver
Wikipedia — 2026 Iran War Fuel Crisis (ongoing, frequently updated)
CNN — Oil Briefly Touches $126, Highest Price in Four Years
CNN — Oil Prices Increase After Iran Doubles Down on Strait of Hormuz Closure
NBC News — Gas Prices Hit $4.23 Per Gallon, a New High for the Year
CBS News — Iran War and Strait of Hormuz Stuck in Limbo
Electrek — The Oil Crisis Is Making Drivers Realize They Can’t Afford Not to Drive Electric
AAA — Daily Gas Price National Averages
U.S. Energy Information Administration — Weekly Gasoline and Diesel Prices
U.S. Department of Energy — fueleconomy.gov Driving Tips
U.S. Department of Energy — Vehicle Maintenance and Fuel Economy
U.S. Department of Energy — Alternative Fuels Data Center Vehicle Cost Calculator


Leave a Reply
You must be logged in to post a comment.