





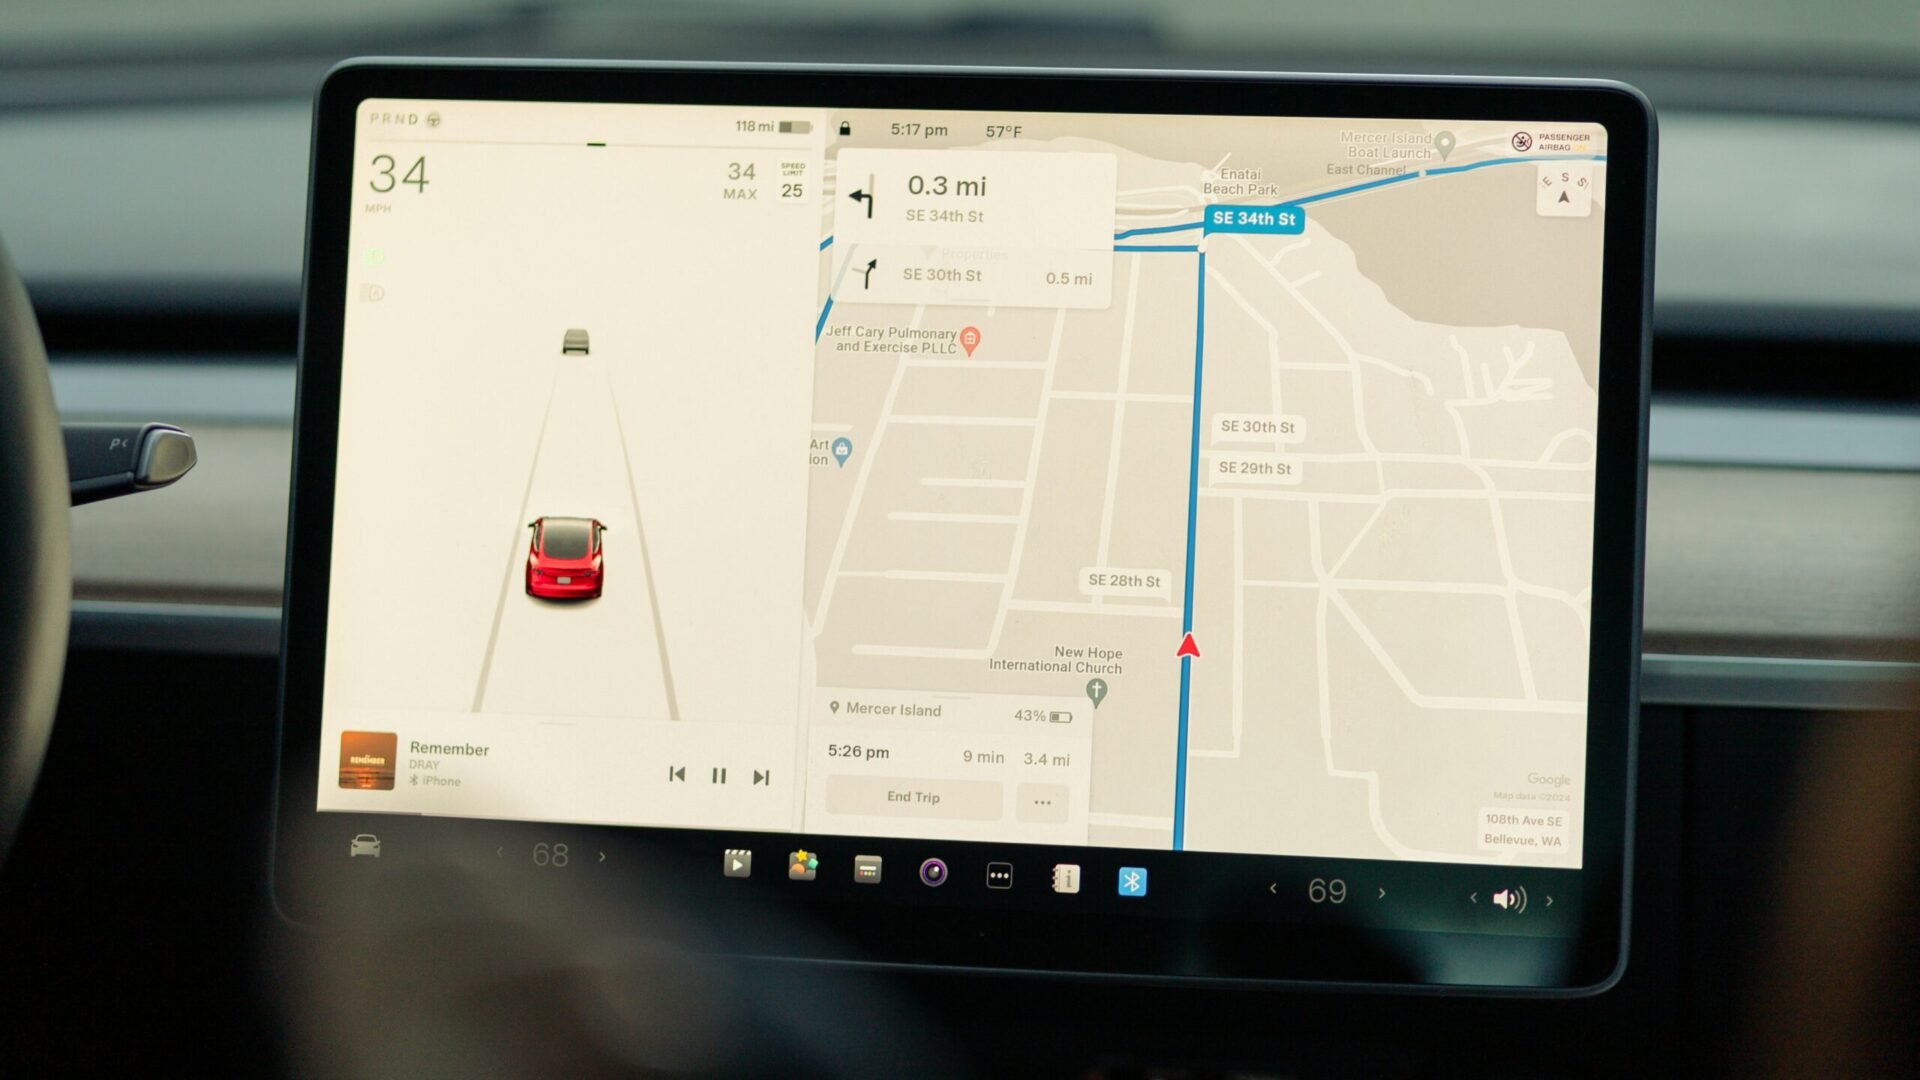
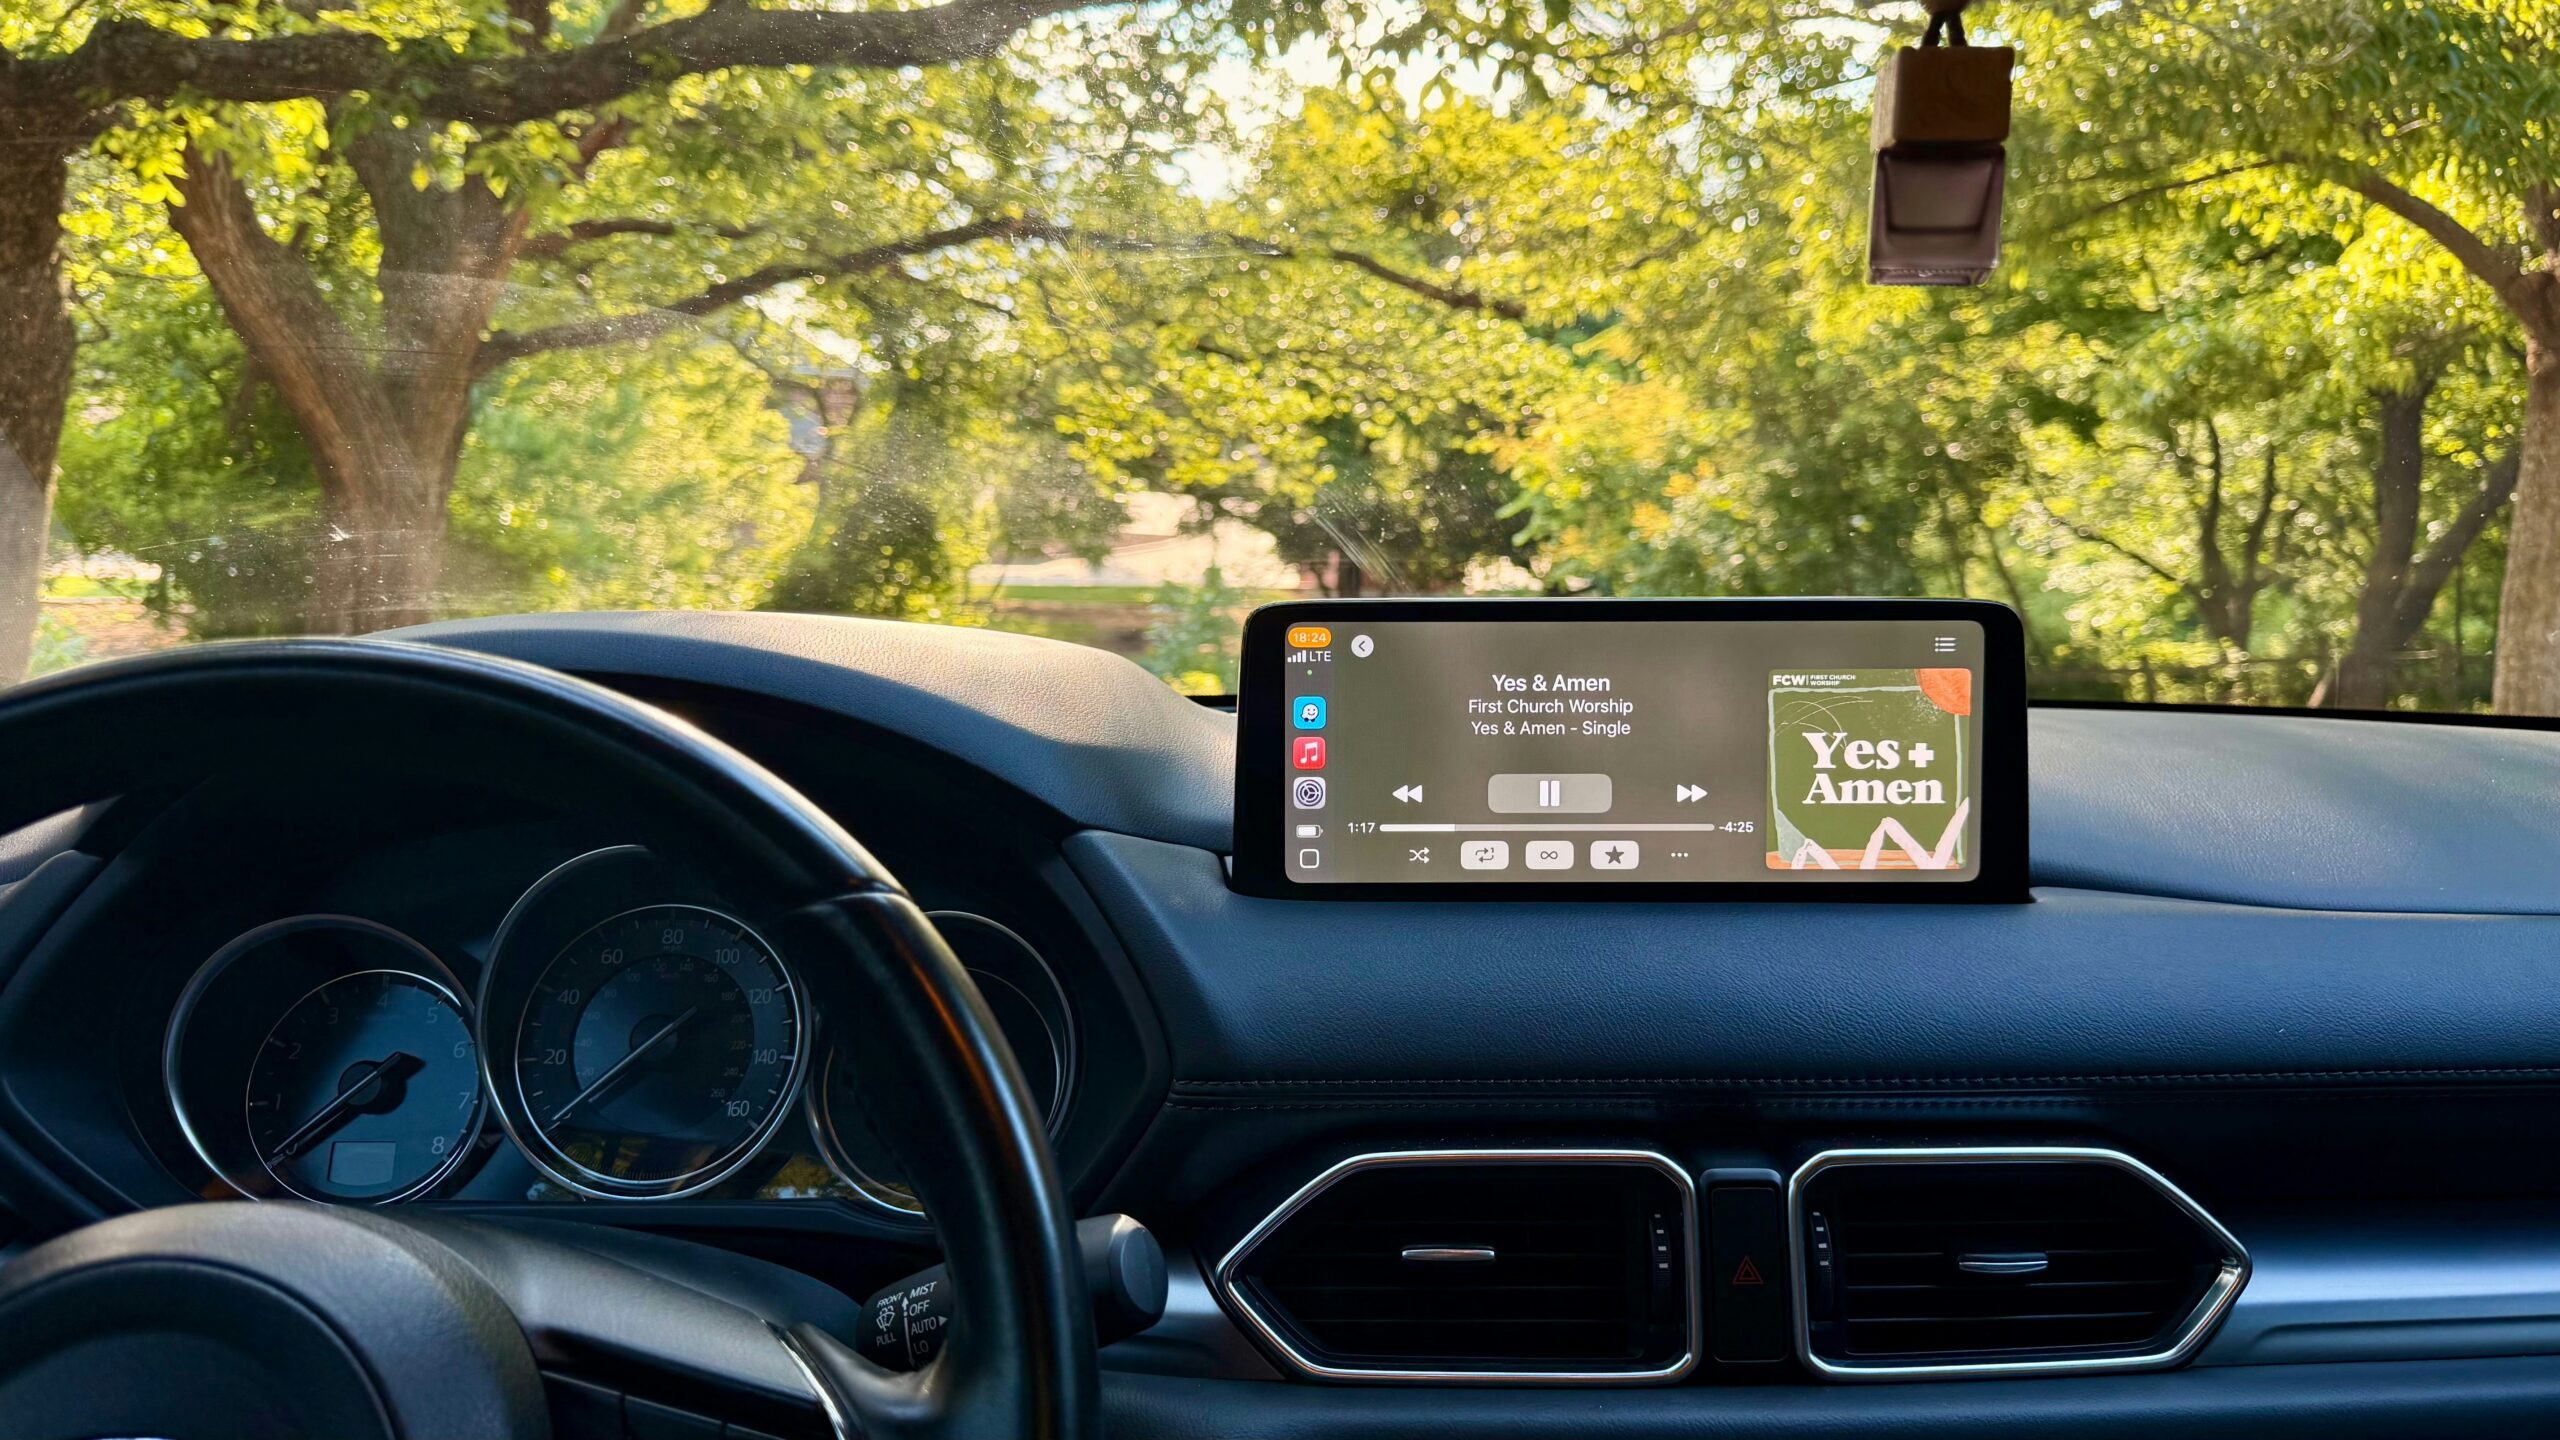















The marketing is unambiguous. Enroll in Progressive Snapshot, State Farm Drive Safe & Save, Allstate Drivewise, or any of a dozen other usage-based insurance programs and the ads promise savings of 20%, 30%, even 40% on your auto premium. Drive carefully, the message goes, and the insurer rewards you. It sounds like the one place in modern insurance where the consumer finally gets what they deserve for doing the right thing.
The actual numbers are more complicated. In the most comprehensive state-level data set available — Maryland’s 2023 enrollment figures analyzed by the Consumer Federation of America — 31% of telematics-enrolled drivers saw their premiums decrease, 45% saw no change at all, and 24% saw premiums increase. That means almost one in four drivers who signed up expecting to save money ended up paying more instead. The advertised 30-40% discounts are maximum values, not typical ones, and the actual median savings for a telematics-enrolled driver come in closer to 5–7% a year.
This article is about the other side of the telematics pitch — who gets penalized, who gets structurally disadvantaged by the way UBI programs are built, and where the data goes once the insurer has it. It is not an argument against telematics. For drivers whose patterns match what UBI programs were designed around, the discounts are real and worth taking. But the pitch misses the drivers for whom enrollment makes things worse. The How Insurers Assess Vehicle Risk article covers the broader rating model and UBI programs’ upside; this one focuses on the downside.
The Numbers Underneath the Marketing
The gap between advertised savings and actual outcomes is the first thing to understand. When Nationwide SmartRide advertises “up to 40% off,” the “up to” is doing heavy lifting. That 40% represents a theoretical maximum achieved by a very small share of drivers — essentially those who already match an ideal risk profile and happen to drive little, during daylight hours, on uncongested roads.
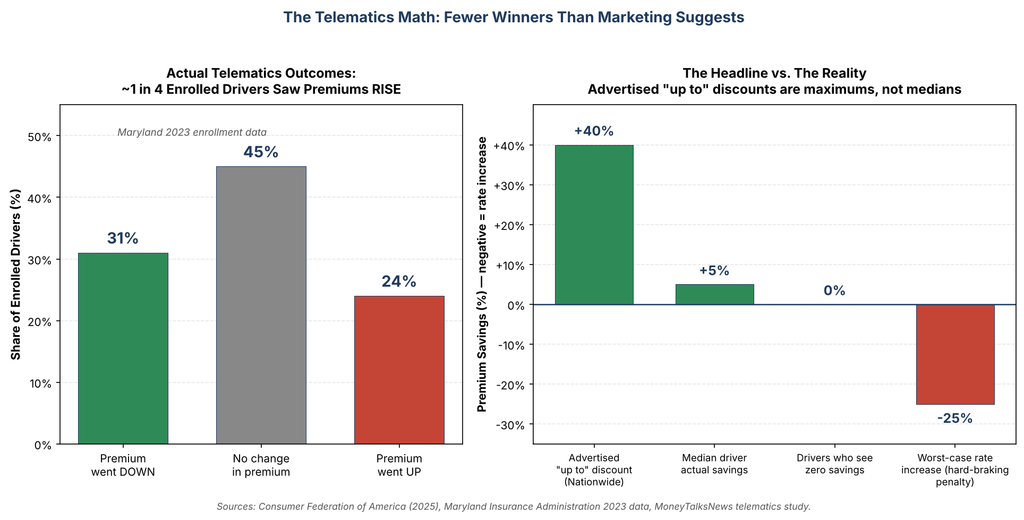
The Maryland 2023 data, analyzed by the Consumer Federation of America, breaks down the actual outcomes clearly. Of enrolled drivers:
- 31% saw premiums decrease — the winners, averaging a discount in the 10–20% range
- 45% saw no change — the data was recorded, but their behavior did not meet the thresholds to earn either a discount or a penalty
- 24% saw premiums increase — the losers, in programs that allow penalties (not all do)
Maryland is not unique. Industry data from MoneyTalksNews puts the median telematics driver’s savings at around $120 per year — a meaningful number, but one that represents roughly 5% off a typical $2,400 premium rather than the 30% or 40% headline figures. For many drivers, the savings do not justify the ongoing privacy cost; for roughly a quarter of enrolled drivers, the outcome is net negative.
The reason the gap exists is simple. Insurers have strong financial incentives to give the maximum discount to the drivers who present genuine actuarial risk reduction. They have no such incentive to give large discounts to drivers whose measured behavior does not actually correspond to lower claims risk. The programs are built to capture the first group while treating the second group as a data source without rewarding them for sharing it.
Penalty Programs vs Discount-Only Programs
The single most important question before enrolling in a UBI program is whether the specific program can raise your premium or only lower it. The answer varies significantly by carrier, and most drivers do not know which type they are signing up for until it is too late.
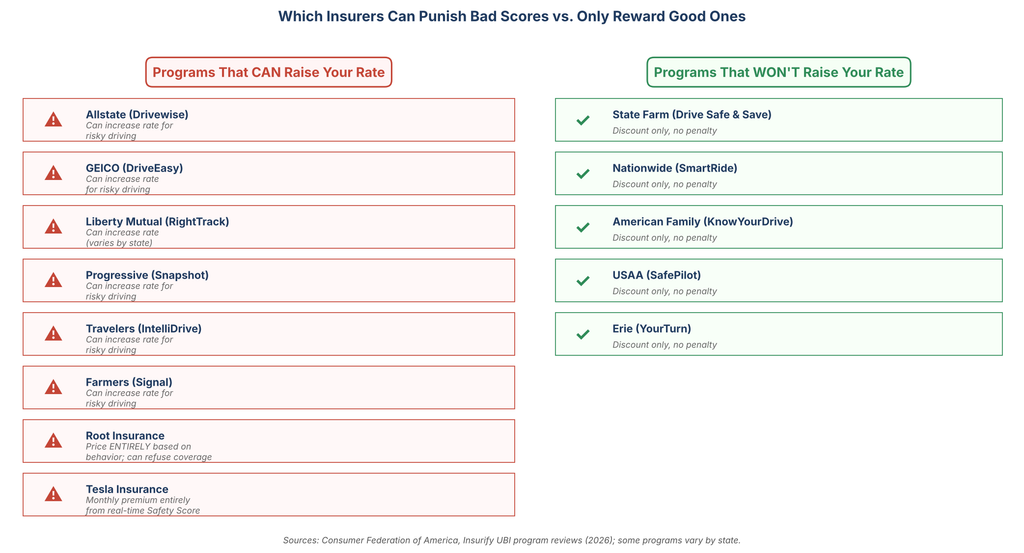
The penalty-capable programs include most of the largest UBI offerings: Allstate Drivewise, GEICO DriveEasy, Liberty Mutual RightTrack, Progressive Snapshot, Travelers IntelliDrive, Farmers Signal. In these programs, a driver who signs up expecting a discount can be assigned a surcharge instead if measured behavior triggers the insurer’s risk thresholds. The surcharge typically applies at renewal and can range from a few percent to 25% or more.
Root Insurance and Tesla Insurance operate differently — they price the entire premium based on measured behavior. For Root, enrollment is mandatory to even get coverage; the behavioral score determines whether the driver is offered a policy at all and at what price. Tesla Insurance recalculates monthly based on the vehicle’s real-time Safety Score. For drivers whose scores run high, these models often produce the deepest savings in the market; for drivers whose scores run low, they produce either no coverage offer or premiums above traditional alternatives.
The discount-only programs — State Farm Drive Safe & Save, Nationwide SmartRide, American Family KnowYourDrive, USAA SafePilot, Erie YourTurn — cannot raise a premium based on telematics data in most states, though a few state-specific variations exist. For drivers who are uncertain how their driving will measure, these are the safer enrollment choices.
The risk is that marketing materials rarely surface the penalty potential clearly. Progressive Snapshot’s advertising emphasizes the enrollment discount (typically 5%) and the potential for up to 30% off at policy renewal; the possibility of a surcharge for aggressive driving is disclosed but usually in smaller text and later in the signup flow. The Consumer Federation of America has formally petitioned insurers to make the penalty risk more prominent at enrollment.
Who Gets Penalized Unfairly
Even in penalty-capable programs, the worst outcomes are not random. UBI algorithms were designed around a specific implicit driver profile — the suburban commuter with a predictable daytime schedule, a short route, and uncongested roads. Drivers whose patterns deviate from that profile get penalized not for being genuinely higher-risk drivers, but for being different kinds of drivers.
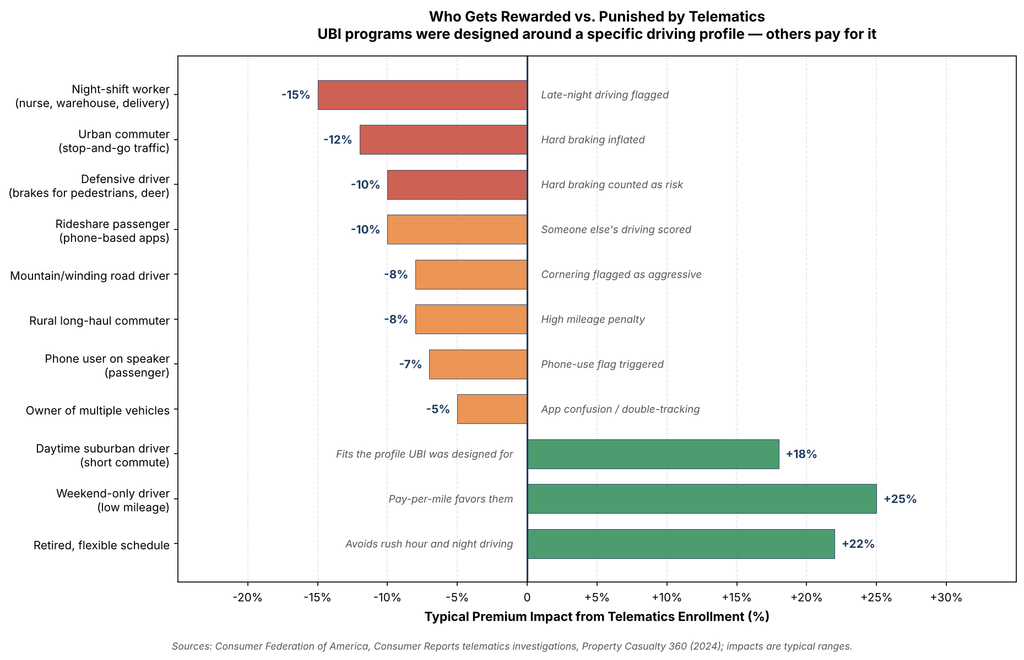
Night-shift workers — nurses, warehouse employees, delivery drivers, emergency responders — are penalized by the late-night driving factor that most UBI programs weight heavily. The underlying actuarial logic is that aggregate crash risk is higher between midnight and 5 AM, which is true at the population level. But a nurse driving home from a 7 PM to 7 AM shift on familiar, empty roads is not the same risk profile as a drunk driver on the same roads at the same hour. The algorithm cannot tell the difference, and the Consumer Federation of America has documented how this disproportionately penalizes lower-income workers whose jobs require off-hours commutes.
Urban commuters in dense traffic get penalized through the hard-braking metric. Stop-and-go freeway traffic requires aggressive braking by physical necessity — the driver ahead stops; the car behind must stop or hit it. UBI algorithms register each hard brake as a risk signal regardless of whether it was reactive or avoidable. A driver on I-95 through the Northeast corridor accumulates far more “hard braking events” than one on a rural interstate even when driving identically.
Defensive drivers — the ones who brake to avoid the squirrel, the pedestrian who stepped off the curb, the deer crossing at dusk — similarly get flagged by the same hard-braking metric. The behavior that prevents accidents gets scored as the behavior that causes them.
Rideshare and taxi passengers whose phones have the UBI app installed can see their own insurance scores affected by someone else’s driving when the app can’t tell who is holding the phone. Multiple documented cases exist of Uber passengers accumulating penalty events while being driven. The app vendors have added heuristics to detect this (phone orientation, acceleration patterns that suggest a passenger rather than driver), but the detection is imperfect.
Mountain and winding-road drivers accumulate cornering force penalties on routes that cannot be driven without them. The algorithm treats cornering G-forces above a threshold as aggressive, regardless of whether the driver was actually driving fast or simply navigating a hairpin.
Rural long-haul commuters who drive 30,000+ miles per year get hit with mileage-based penalties even when the driving itself is low-speed highway cruising that is actuarially among the safest driving there is.
Owners of multiple vehicles who use the same app across their cars often see data confusion that produces inflated event counts — a hard brake in the sedan gets attributed to the pickup, or vice versa.
Weekend-only and retired drivers with flexible schedules, by contrast, are the structural winners. Low mileage, daylight driving, avoidance of rush hour and late nights, and typically suburban or low-traffic routes combine into exactly the profile UBI was designed to reward. The gap between their outcomes and the night-shift nurse’s outcome is one of the clearest fairness failures in the current telematics regime.
Phone-Based Apps and Their Error Modes
Most modern UBI programs have shifted from plug-in OBD-II devices to smartphone apps. The economic advantage for insurers is obvious — no hardware to ship, no returns to process, no device failures. The disadvantage for drivers is that phones are less accurate measurement tools than purpose-built telematics hardware.
Several failure modes are well-documented. Phones mounted in cupholders register the car’s deceleration events as phone-based “phone use while driving” because the accelerometer cannot distinguish between vehicle motion and user manipulation. Bluetooth-connected phones sometimes don’t register trips at all if the Bluetooth connection drops mid-drive, which the algorithm interprets as the driver turning off tracking to hide bad behavior. Speaker-phone calls while driving register as handheld phone use on some platforms. Phone use by passengers in the car registers as the driver’s use when the app cannot determine which seat the phone is in.
The result is that UBI scores often reflect the quality of a driver’s phone-handling habits as much as their actual driving. A driver who leaves the phone in a cupholder gets different scores than one who docks it; a driver whose passenger regularly uses the phone gets different scores than one who drives alone. Neither of these variations tracks actual crash risk, but both feed the insurance premium calculation.
The newer vehicle-native programs — Tesla Insurance using the car’s own sensors, GM’s discontinued Smart Driver, Ford’s embedded telematics, Hyundai Bluelink — avoid the phone accuracy problem but introduce their own. Tesla’s Safety Score weights forward collision warnings heavily, which means the system’s own false positives (a stationary object incorrectly flagged as a crash target) can lower a driver’s score without any actual risky behavior.
The Data Keeps Flowing After the Discount Ends
One of the least-discussed aspects of UBI enrollment is what happens to the data when a driver stops participating. Most programs collect data continuously for a monitoring period (typically 30 to 180 days), after which the final score is locked in. But the data collected during that window remains with the insurer and in some cases with third-party processors indefinitely.
Several insurers use telematics contractors rather than collecting data directly — including LexisNexis, Verisk Analytics, and Cambridge Mobile Telematics. The Consumer Federation of America found in 2025 that of 16 major UBI-offering insurers, only 5 collected the data directly; the other 11 relied on third-party processors. That contracting layer adds complexity to the question of who actually holds the data and under what retention terms.
In worst-case scenarios documented in 2024, telematics data has been used in claim disputes to challenge a driver’s version of events after an accident. If a driver reports being stopped at a traffic light when rear-ended, and the telematics data shows acceleration for the preceding few seconds, the insurer may use that data to argue partial fault. The data was ostensibly collected for premium calculation, but once the insurer has it, the use cases expand.
The 2024 GM/OnStar/LexisNexis scandal — covered in detail in the Automakers Are Collecting Your Telematics Data article — showed one way this data can leak from the ostensibly consented-to UBI context into broader data-broker ecosystems that drivers never explicitly agreed to. GM’s Smart Driver data was sold to data brokers who in turn sold it to insurance companies that then raised drivers’ rates based on data they had no idea existed. The automakers and data brokers involved have largely pulled back from this specific practice under regulatory and litigation pressure, but the structural possibility remains.
Privacy Tradeoffs Nobody Discusses Upfront
A telematics app captures more than just driving metrics. The app typically has permission to access location (continuous), motion sensors (continuous), notifications (to detect calls and texts during driving), and in some cases contacts or calendar information. Insurance privacy policies generally allow sharing with “affiliates” and “service providers,” categories broad enough to include marketing partners, credit bureaus, and in some cases data brokers.
The specific data categories collected by most UBI programs include battery level and charging patterns, fuel levels, altitude data, turn signal use, adaptive high-beam activation, phone screen activity during trips, approximate passenger count via accelerometer patterns, idle time at stops, and in some cases ambient noise levels. Very little of this has obvious bearing on driving risk; most of it is collected because the sensor is already there and the data has potential future uses.
The Mozilla Foundation’s 2023 vehicle privacy review (covered in the Automakers Are Collecting Your Telematics Data article) found that 76% of car brands reserve the right to sell personal data and 84% to share it with service providers and data brokers. UBI data falls within those broad data categories at nearly every major insurer.
Specific concerns from Consumer Federation of America and Consumer Reports research include:
- Behavioral inferences beyond driving — data that reveals when someone leaves home, where they shop, how often they visit specific addresses, whether they regularly travel to healthcare facilities or recovery meetings
- Location data retention often extending years past the monitoring period
- Score use in non-insurance contexts — some documented cases of UBI scores being queried for employment screening, particularly for commercial drivers
- Limited portability — the data collected by one insurer typically does not transfer if the driver switches carriers, meaning drivers rebuild their score from scratch each time
- Limited correction rights — drivers have little ability to dispute specific events flagged by the algorithm
Does Telematics Even Measure What It Claims To?
A quieter question underneath the fairness concerns is whether the behavioral metrics UBI programs score actually predict crash risk at the individual level. The industry evidence on this is more mixed than marketing suggests.
At the population level, aggregate metrics like late-night driving, hard-braking frequency, and high-speed driving do correlate with higher claim rates. These correlations are what make insurance actuaries confident in behavioral scoring at scale. At the individual level, however, the signal is substantially weaker. Two drivers with identical UBI scores can have very different actual crash risk profiles because the measurable behaviors capture only a narrow slice of what determines whether a specific driver will have an accident.
Factors that strongly predict crash risk but that UBI largely cannot measure include: driver fatigue (phone sensors can’t reliably detect it), cognitive load and distraction (unless it involves phone use), driving while on specific medications, familiarity with the route (a driver on familiar roads is much safer than on unfamiliar ones), weather handling skill, and reaction time to unexpected events. The visible metrics UBI does measure often correlate with these underlying risk factors only weakly.
The stronger predictors in aggregate claim data remain the traditional rating factors — driver age, prior driving record, location, vehicle choice, credit (where legal), and annual mileage. Telematics adds marginal predictive power on top of these, but it does not replace them. For individual drivers, the implication is that the telematics score is not necessarily a fair reflection of personal risk — it is a measurement of specific behaviors that correlate imperfectly with risk in aggregate.
What to Do If You’re Already Enrolled
For drivers currently in a UBI program whose score has not been as good as hoped, the practical options are limited but not zero:
- Check your monitoring window end date. Most programs lock in the final score at a set point (often 90 or 180 days). If you’re near the end and your score is poor, finishing may be better than canceling, because canceling can forfeit even the enrollment discount.
- Review your trip-by-trip data. Most apps let you drill into individual trips. If events are concentrated in one or two trips with specific explanations (a ride home as a passenger, a defensive maneuver), some insurers will consider manual review on request.
- Shift to a discount-only program. If your current program penalizes bad scores, switching to State Farm, Nationwide, American Family, USAA, or Erie means the downside is capped.
- Consider pay-per-mile for very low-mileage drivers. Metromile (now Lemonade), Mile Auto, and Allstate Milewise price based primarily on miles driven rather than behavior scoring. For drivers under 7,500 miles per year, these often beat both traditional and UBI pricing.
- Delete the app completely when the monitoring period ends. The app continues collecting data even after score lock-in; manual removal stops the collection from your end even if the insurer retains what was already gathered.
- For rate increases attributed to data you did not knowingly share, file a complaint with the state insurance commissioner. In the aftermath of the GM/OnStar scandal, several state regulators have been actively processing such complaints.
The How Insurers Assess Vehicle Risk article covers the other levers available to lower a premium regardless of telematics decisions, and the Why EVs Have Different Insurance Costs piece covers the EV-specific overlay on top of the general insurance pricing environment.
The Takeaway
Telematics-based insurance works as advertised for a specific kind of driver — the daytime suburban commuter with predictable patterns, short routes, and the discipline to drive the way the algorithm rewards. For those drivers, enrollment can mean legitimate 20–40% discounts, and the privacy tradeoff may be worth it. For a meaningful minority of drivers — roughly one in four in the best available data — it means a premium increase instead of a discount. For drivers whose job, geography, or vehicle type puts them outside the design envelope, it means paying a penalty for being a different kind of driver rather than a riskier one.
The specific program choice matters enormously. Discount-only programs have no downside risk; penalty-capable programs can backfire. Vehicle-native programs collect different data than phone-based programs. Pay-per-mile programs price almost entirely on mileage and avoid most of the behavioral scoring pitfalls.
Beyond the individual program choice, the structural issues — algorithmic penalties for night-shift and urban drivers, data collection far beyond driving behavior, use of telematics data in claim disputes, and the broader connected-car data ecosystem described in the companion articles — have not been resolved. They are being actively litigated, legislated, and regulated at the state level in 2026, but the current environment still places most of the burden on individual drivers to read the fine print.
The most useful mental model for a shopper is that the telematics discount is real for those it suits and that the penalty risk is real for those it doesn’t. Figuring out which category you fall into before enrolling is worth more than any single rate comparison.
External Sources
Consumer Reports and CFA — Open Letter on Telematics Transparencyance companies alike.
Insurance.com — How Telematics and AI Affect Car Insurance Rates and Data Privacy
Consumer Reports — Car Insurance Telematics Pros and Cons
MoneyTalksNews — Telematics Saves the Median Driver $120 a Year
Consumer Federation of America — Auto Telematics White Paper
Repairer Driven News — Consumer Reports Raises Red Flags Over Telematics Programs
Insurify — Auto Insurance Rate Hike? Your Phone Might Be to Blame
Sinas Dramis Law Firm — Risks of Car Insurance Tracking Devices
Insurify — Telematics Car Insurance 2026 Guide





















Leave a Reply
You must be logged in to post a comment.