


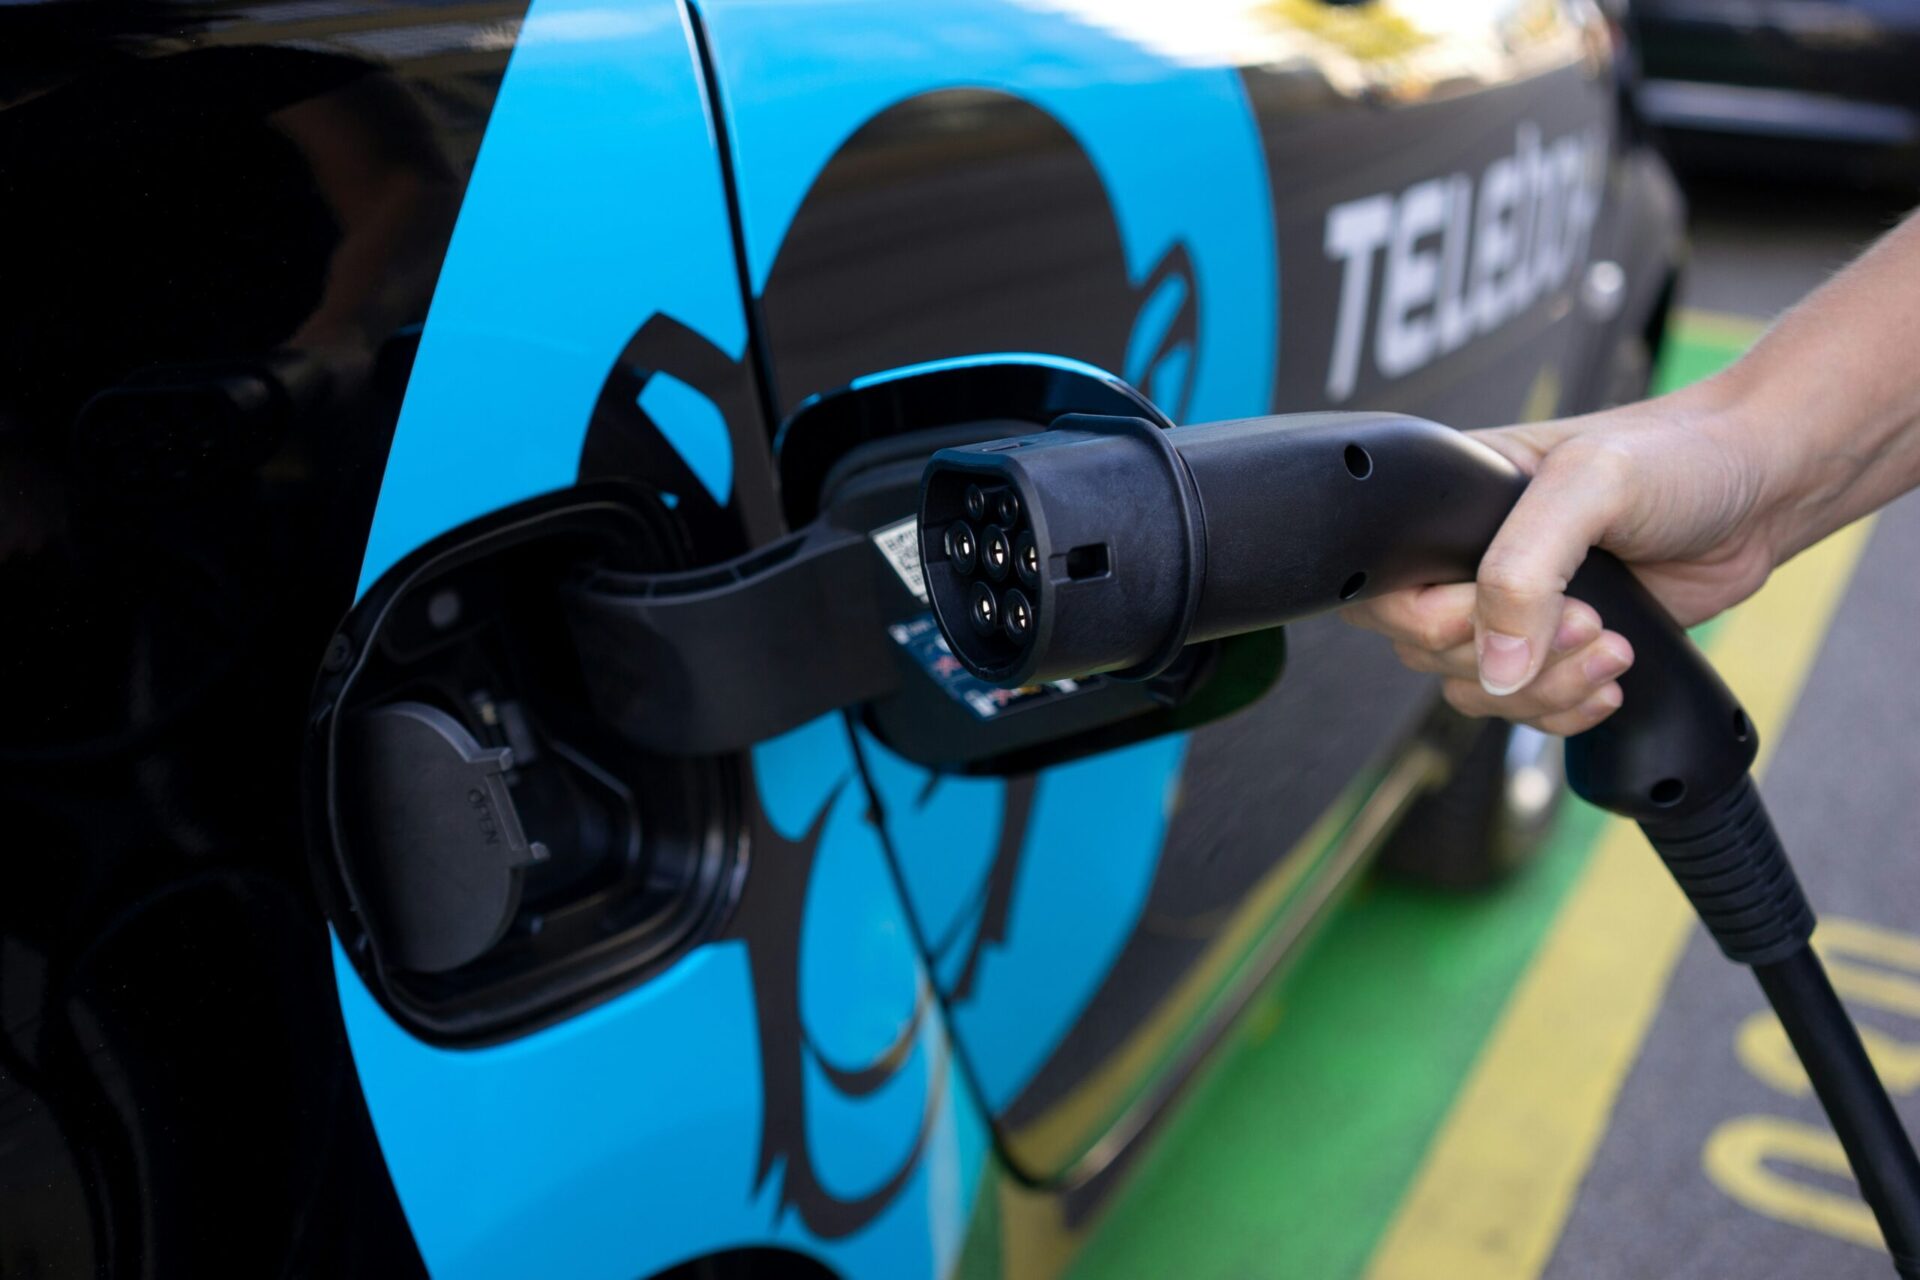
Imagine you’re on a road trip in your electric vehicle, and you pull into a DC fast-charging station with 15% battery remaining. You plug in, and within the first ten minutes, you’ve already gained 40% charge. Feeling good, you grab a coffee. But when you come back 20 minutes later, you notice the charging has slowed to a crawl — and you’re only at 85%. What happened?
What you’ve just experienced is the fast-charging curve in action. It’s one of the most important — and most misunderstood — concepts in EV ownership. Whether you’re considering your first electric vehicle or you’ve been driving one for years, understanding how your EV’s battery accepts energy from a fast charger can save you significant time, money, and frustration on the road.
This guide breaks down the science behind EV charging curves, compares how different vehicles and battery chemistries perform, and gives you actionable strategies to charge smarter.
What Is a Fast-Charging Curve?
A fast-charging curve is a graph that shows how much power (measured in kilowatts, or kW) your EV’s battery accepts over the course of a DC fast-charging session. It is not a flat, straight line. Instead, it rises, plateaus, and then tapers off as the battery fills up.
Think of it like filling a glass of water. When the glass is nearly empty, you can pour quickly without worrying about spillage. But as it nears the top, you slow down to avoid overflowing. Your EV’s Battery Management System (BMS) works in a similar way — it controls how much energy flows into the battery to prevent overheating and damage.
According to the U.S. Department of Transportation, DC fast-charging equipment can charge a battery electric vehicle to 80% in just 20 minutes to one hour, depending on the vehicle and charger. But that last 20% can take nearly as long as the first 80%, which is where understanding the charging curve becomes critical.
How Lithium-Ion Batteries Charge: The Science
To understand why charging slows down, you need to understand a little about how lithium-ion batteries work at a fundamental level.
EV batteries store and release energy by moving lithium ions between two electrodes: the anode (negative side) and the cathode (positive side). When you charge the battery, lithium ions travel from the cathode to the anode and embed themselves into the anode’s structure — a process called intercalation.
At low states of charge, there is plenty of room in the anode for incoming ions. The Battery Management System allows high current flow, and the charger delivers energy at or near its peak power. This is called the constant current (CC) phase.
As the battery fills up, several things happen simultaneously that force charging to slow down:
- Voltage increases. As ions pack into the anode, the battery’s voltage rises. The shrinking gap between the charger’s voltage and the battery’s voltage naturally reduces the flow of current.
- Heat builds up. High charging rates generate significant heat. The BMS reduces power to keep the battery within its optimal operating temperature range (typically 20–40°C), as noted by S&P Global’s analysis of EV charging efficiency.
- Lithium plating risk increases. If ions arrive faster than they can embed into the anode, metallic lithium can deposit on the anode’s surface. This permanently reduces capacity and, in extreme cases, can create dendrites — needle-like structures that risk short-circuiting the cell.
- Cell balancing kicks in. At higher states of charge, the BMS must ensure all individual cells within the battery pack are at equal voltage levels, which takes time and reduces overall charging speed.
This transition from high-power delivery to reduced power is called the constant voltage (CV) phase or the taper. It’s an electrochemical reality — not a design flaw.
The Three Stages of Fast Charging

While every EV has a unique charging curve, most follow a general three-stage pattern:
Stage 1: Rapid Charging (Approximately 10–60% State of Charge)
This is where fast charging lives up to its name. The battery is relatively empty, its temperature is manageable, and the BMS allows the charger to deliver power at or near the vehicle’s peak acceptance rate. Depending on the vehicle, this can range from 50 kW on older or budget EVs up to 350 kW on the latest high-performance models.
For many modern EVs, the 10–60% window is where you get the most range per minute of charging. According to Recurrent Auto’s 2026 analysis of the fastest-charging EVs, the Hyundai Ioniq 5 can add 100 miles of range in just 5.79 minutes during this phase, making it one of the quickest-charging vehicles on the market.
Stage 2: Moderate Charging (Approximately 60–80% State of Charge)
As the battery crosses 60% (or sometimes 50%, depending on the vehicle), the charging curve begins to taper. Power output might drop from 200+ kW down to 70–100 kW. The BMS is actively managing heat and protecting the cells from degradation. You’ll still gain range at a reasonable pace during this phase, but the rate of return is declining.
This is why the “charge to 80%” rule of thumb exists. The U.S. Department of Energy’s Alternative Fuels Data Center notes that charging speed slows as the battery gets closer to full to prevent damage — making it more cost- and time-efficient to use DC fast charging until the battery reaches 80% and then continue driving.
Stage 3: Trickle Charging (Approximately 80–100% State of Charge)
In the final stage, charging power drops dramatically — often to just 5–20 kW. The BMS is carefully trickling energy into the battery to avoid overcharging any individual cell. For many vehicles, charging from 80% to 100% can take as long as the entire 10–80% session.
This stage is best reserved for overnight home charging on Level 2 (240V) equipment, not for DC fast charging during a road trip. Sitting at a public fast charger during this phase is expensive, slow, and ties up the charger for other drivers.
Why Not All Charging Curves Are Created Equal: Steep vs. Flat
EV charging curves generally fall into two categories, as explained by InsideEVs’ detailed analysis of peak charging rates:
Steep curves spike quickly to a high peak power, then drop off rapidly. A vehicle might hit 250 kW briefly but fall to 100 kW by 50% state of charge. This results in impressive headline numbers but less impressive real-world performance.
Flat curves sustain moderate-to-high power for a longer portion of the charging session. A vehicle that holds 200 kW from 10% to 65% before tapering may have a less dramatic peak, but it often adds range faster overall.
This is why looking only at “peak charging speed” on a spec sheet can be misleading. Two EVs might both claim a 150 kW peak, but one could maintain that rate much longer than the other. The shape of the curve matters more than the peak.
A real-world example: the 2023 Audi e-tron and 2024 Subaru Solterra both offer a peak DC fast-charging rate of 150 kW. The Solterra has a smaller battery. Logically, it should charge faster. But in independent testing cited by InsideEVs, the e-tron reached 80% from zero in 30 minutes, while the Solterra needed 38 minutes. The difference? The Audi maintains a flatter, more consistent charging curve thanks to superior thermal management.
Battery Chemistry: NMC vs. LFP and What It Means for Charging
Not all EV batteries are made from the same materials, and the chemistry inside your battery pack has a direct impact on how it charges, how long it lasts, and how you should manage it.
The two dominant chemistries in today’s EVs are NMC (Nickel Manganese Cobalt) and LFP (Lithium Iron Phosphate).
NMC Batteries
NMC batteries are used in most long-range and premium EVs, including Tesla’s Long Range models, BMW, Mercedes-Benz, and many others. They offer higher energy density — roughly 20–30% more energy per kilogram than LFP — which translates to more range in a lighter, more compact package. NMC batteries also tend to support higher peak charging rates, commonly reaching 200–250 kW in vehicles with adequate thermal management.
The trade-off is sensitivity. NMC batteries degrade faster when regularly charged to 100% or stored at high states of charge, especially in hot climates. Most automakers recommend capping daily charging at 80% for NMC vehicles. Modern NMC cells are rated for approximately 1,000–2,500 full charge cycles to 80% capacity, according to Electrifying.com’s comparison of EV battery chemistries.
LFP Batteries
LFP batteries are found in many standard-range and value-oriented EVs, including Tesla’s Standard Range Model 3 and Model Y, the BYD Atto 3, and a growing number of Chinese-market vehicles. They use iron and phosphate instead of nickel and cobalt, making them cheaper to produce and more ethically sourced.
LFP batteries have a major lifestyle advantage: they can be charged to 100% regularly without significant degradation. Tesla explicitly recommends charging its LFP-equipped vehicles to 100% for daily use. LFP cells are also rated for 3,000–6,000 full cycles — significantly longer than NMC.
The downsides are lower energy density (meaning less range per kilogram), slower peak charging rates (typically maxing out around 150–170 kW), and reduced performance in cold weather. Below -20°C, LFP batteries may retain only 60–70% of their rated capacity, compared to 70–80% for NMC, as reported by Motorwatt’s 2026 comparison.
For fast-charging purposes, the key difference is this: LFP batteries tend to taper their charging power more aggressively above 60% state of charge, making 10–80% sessions somewhat slower than equivalent NMC vehicles on the same charger. However, their resilience to repeated fast charging means you don’t need to worry as much about long-term degradation from frequent DC fast-charging use.
Beyond NMC and LFP, the next generation of battery chemistry — solid-state batteries — promises to change these trade-offs entirely.
Does Fast Charging Actually Damage Your Battery?
This is one of the most common questions among EV owners, and the answer has become more nuanced thanks to real-world data.
A widely cited study by Recurrent Auto, which analyzed over 12,500 Tesla vehicles in the United States, found no statistically significant difference in range degradation between vehicles that used fast charging more than 90% of the time and those that fast-charged less than 10% of the time. The study examined over 160,000 data points from vehicles made between 2012 and 2023.
This doesn’t mean fast charging has zero impact on batteries from a physics perspective — lab studies consistently show that higher charging rates do generate more heat and stress. But what it does suggest is that modern Battery Management Systems are sophisticated enough to protect the battery during normal fast-charging use. Tesla’s BMS, for example, dynamically adjusts power delivery based on battery temperature, state of charge, and environmental conditions.
A 2025 study published in the Journal of Power Sources on ScienceDirect took this further by testing NMC, NCA, and LFP cells under different ratios of fast-to-slow charging. The researchers found that while more fast charging does result in more degradation, the economic impact varies enormously by chemistry. LFP cells showed the least cost impact from frequent fast charging (estimated $0 in replacement costs over 150,000 miles), while NCA cells showed the most ($210,000 in extreme scenarios with over 90% fast charging and full voltage range cycling).
The practical takeaway: for most drivers using modern EVs with good thermal management, occasional to moderate fast charging is unlikely to cause meaningful battery degradation within the vehicle’s useful life. Best practices still apply — avoid fast charging in extreme heat, precondition the battery in cold weather, and don’t regularly fast-charge to 100%.
The 800-Volt Revolution: Why It Changes Everything
One of the most significant recent developments in EV charging technology is the shift from 400-volt to 800-volt battery architecture.
Most EVs on the road today use 400-volt systems. Tesla’s Model 3, Model Y, and most BMW, Mercedes, and Ford EVs fall into this category. These systems are limited to charging speeds of roughly 150–250 kW, depending on the vehicle and charger.
800-volt systems, by contrast, can support charging speeds up to 350 kW because higher voltage allows the same power to be delivered with less current — and less current means less heat. This lets the BMS maintain high charging power for a longer portion of the session, resulting in a flatter, more efficient charging curve.
The first production car to use 800V architecture was the Porsche Taycan, which launched in 2019. Porsche’s engineering team recognized that doubling the voltage was the key to making fast charging truly competitive with refueling a gas car. According to OnOff.gr’s analysis of 800V architecture, the 2025 Taycan Turbo S can charge from 5% to 80% in just 22.5 minutes with a peak charging power of 300 kW.
But it was Hyundai Motor Group that democratized this technology. Their E-GMP (Electric Global Modular Platform) brought 800V architecture to mainstream price points with the Hyundai Ioniq 5, Ioniq 6, Kia EV6, and Kia EV9. These vehicles can charge from 10% to 80% in approximately 18 minutes on a compatible 350 kW charger, and a quick five-minute stop can add roughly 100 km (62 miles) of range.
Other automakers now using or developing 800V systems include Audi (e-tron GT), Lucid (Air, Gravity), Lotus (Eletre), BYD (premium models), and Xiaomi (SU7). Tesla still uses 400V architecture in the Model 3 and Model Y but compensates with highly efficient battery management and its extensive Supercharger network. Tesla’s Cybertruck and Semi use 800V systems, and the company is expected to transition fully to 800V with its next-generation platform.
EV Charging Levels: A Quick Reference
Before diving into road-trip strategy, it’s worth understanding the three levels of EV charging, as defined by the U.S. Department of Energy’s AFDC:
Level 1 (120V AC): Uses a standard household outlet. Delivers 1.3–2.4 kW, adding roughly 4–6 miles of range per hour. Useful only for overnight “emergency” charging. A full charge on a 250-mile EV could take two days.
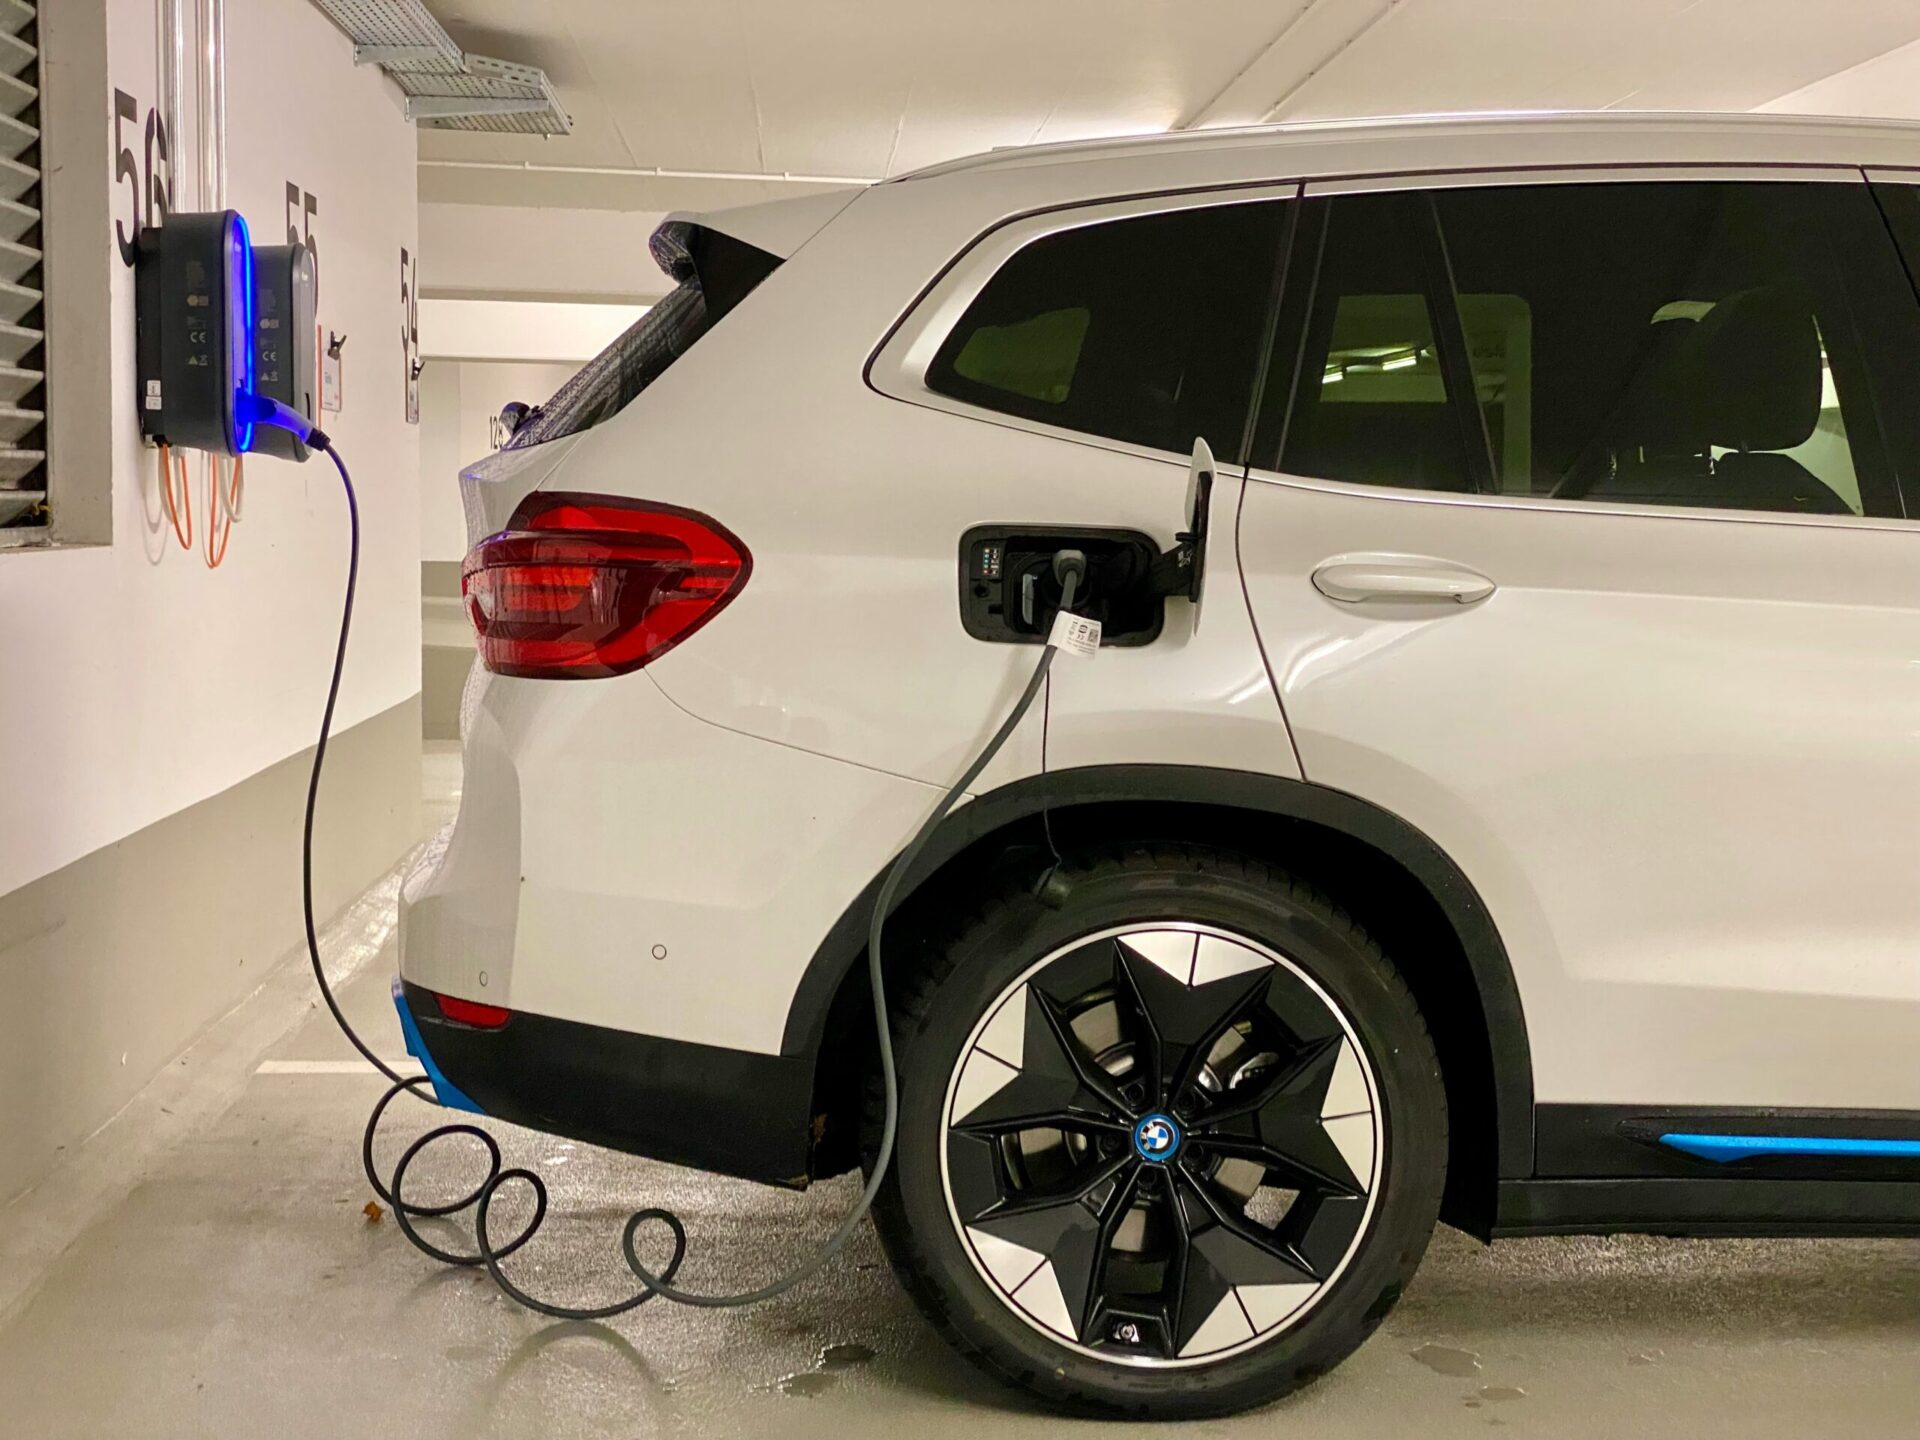
Level 2 (240V AC): Uses a dedicated 240-volt circuit, like a dryer outlet. Delivers 4–19.2 kW, adding 12–54 miles of range per hour. This is the standard for home charging, workplace charging, and public destination chargers. A full charge takes 4–10 hours depending on the vehicle and charger output.
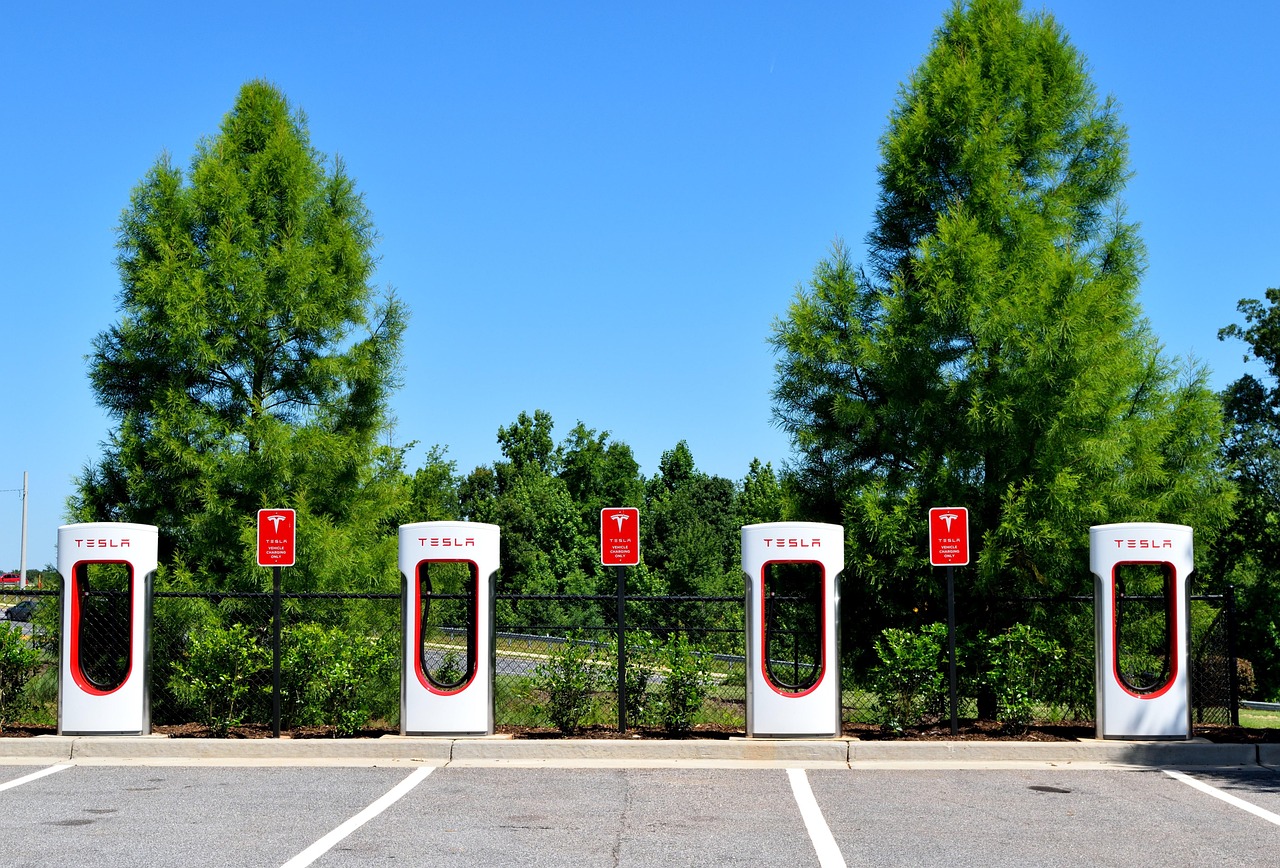
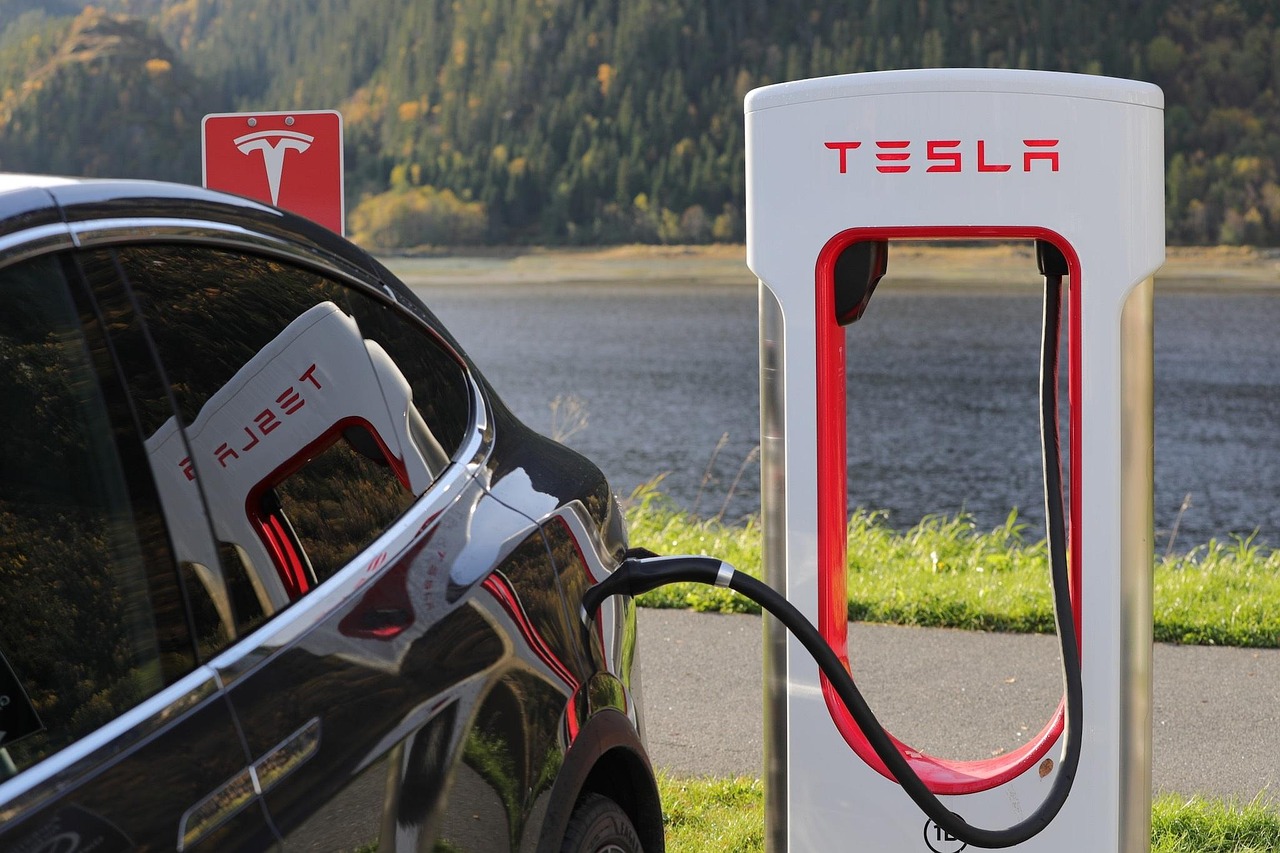
Level 3 / DC Fast Charging (DCFC): Bypasses the vehicle’s onboard charger entirely and delivers DC power directly to the battery at 50–350+ kW. Can charge to 80% in 15–60 minutes. This is what you use on road trips at stations operated by networks like Tesla Supercharger, Electrify America, EVgo, and ChargePoint.
The key difference is that Level 1 and Level 2 charging deliver AC power, which must be converted to DC by the vehicle’s onboard charger — a process that limits speed. DC fast charging does the conversion at the station and feeds the battery directly, which is why it’s so much faster.
Road-Trip Charging Strategy: How to Use the Curve to Your Advantage

Understanding the charging curve gives you a tactical edge on road trips. Here’s a practical framework for optimizing your stops:
1. Arrive at the Charger Between 10–20% State of Charge
This puts you squarely in the rapid-charging zone. You’ll receive maximum power for the longest possible duration. Arriving at 50% or 60% means you’re already past the peak of the curve and won’t gain as much benefit from the fast charger.
2. Charge to 80% — Then Get Back on the Road
Unless you absolutely need the extra range, unplug at 80%. The time spent charging from 80% to 100% at a DC fast charger is disproportionately long compared to the range gained. On many vehicles, the last 20% can take as long as the first 80%.
3. Take More Short Stops Instead of Fewer Long Ones
Two 15-minute stops that charge from 15% to 60% each will add more total range than one 45-minute stop that charges from 15% to 95%. This is because you’re spending more time in the high-power zone of the curve during each stop.
4. Precondition the Battery
Most modern EVs will automatically warm (or cool) the battery to its optimal temperature if you set a DC fast charger as your destination in the navigation system. This ensures the battery is ready to accept maximum power when you arrive. Skipping this step — especially in cold weather — can reduce your charging speed by 20–40%, as noted by Charging Advisor.
For a deeper look at how temperature impacts both charging speed and long-term battery health, see our guide to how extreme temperatures affect EV battery health.
5. Know Your Vehicle’s Max Charging Rate
Your vehicle’s peak charging acceptance rate is the bottleneck, not the charger’s output. Plugging a 55 kW Chevy Bolt into a 350 kW charger won’t make it charge any faster — the battery simply won’t accept more than 55 kW. Check your owner’s manual or look up your vehicle’s specs on sites like Recurrent Auto to know what your car can actually handle.
Your vehicle’s charging capabilities also affect its long-term resale value. EVs depreciate faster than any other vehicle segment, so understanding how depreciation works can help you make smarter buying and selling decisions.
6. Use a Route Planner
Apps like A Better Routeplanner (ABRP) factor in your vehicle’s specific charging curve, battery size, current state of charge, weather, and elevation to plan optimal charging stops. These tools can save you 30 minutes or more on a long trip compared to winging it.
The Charging Infrastructure Is Growing Fast
If range anxiety was a legitimate concern five years ago, the charging landscape has changed dramatically. According to the International Energy Agency’s Global EV Outlook 2025, more than 1.3 million public charging points were added globally in 2024 alone — a 30% increase over the prior year. The total number of public charging points added in 2024 roughly equaled the entire global stock that existed in 2020.
In the United States, public charging infrastructure reached nearly 200,000 stations by the end of 2024, according to the AFDC. More than 20% of public EV charging ports in the U.S. are now DC fast chargers, and that percentage is growing as federal funding programs like the National Electric Vehicle Infrastructure (NEVI) Program deploy new high-power stations along highway corridors.
In Europe, the Alternative Fuels Infrastructure Regulation (AFIR) mandates fast-charging stations of at least 150 kW every 60 km along the core TEN-T road network by 2025, with minimum total power output of 400 kW per station, increasing to 600 kW by 2027.
What the Future Holds
Several technologies on the horizon promise to make the charging curve less of a constraint:
Solid-state batteries replace the liquid electrolyte in conventional lithium-ion cells with a solid material. This could allow for faster charging with less heat generation and minimal taper at high states of charge.
Adaptive charging algorithms are already being deployed by automakers like Tesla, Hyundai, and BMW. These systems learn from your driving patterns, ambient conditions, and charger type to optimize the charging curve in real time.
Megawatt-level charging (MCS) is being developed for commercial vehicles like heavy-duty trucks and buses, with power levels exceeding 1,000 kW. While not directly relevant to passenger cars today, this technology will trickle down and push the entire charging ecosystem toward higher power delivery.
Silicon-carbide (SiC) inverters are enabling more efficient power electronics in 800V vehicles, reducing energy losses during charging and allowing the battery to accept power more efficiently.
Conclusion
EV fast-charging curves are not just a technical specification buried in your owner’s manual — they’re a fundamental part of the EV ownership experience that directly impacts how you plan road trips, how much time you spend at chargers, and how long your battery lasts.
The key takeaways are straightforward:
Charging is fastest between 10–60% state of charge on most vehicles. The “charge to 80%” rule exists for a reason — the last 20% is disproportionately slow on a DC fast charger. Battery chemistry matters: NMC batteries charge faster but need more careful management, while LFP batteries are more forgiving but taper earlier. Modern battery management systems have made frequent fast charging far less damaging than previously feared. And 800V architecture is making the gas station comparison — five minutes for hundreds of miles — increasingly realistic.
The next time you pull into a charging station, you’ll know exactly what’s happening inside your battery, why the numbers on the screen are changing, and how to make the most of every minute plugged in.
Sources and Further Reading
- U.S. Department of Transportation — Charger Types and Speeds
- U.S. DOE Alternative Fuels Data Center — Electric Vehicle Charging Stations
- IEA Global EV Outlook 2025 — Electric Vehicle Charging
- Recurrent Auto — Impacts of Fast Charging on EV Batteries
- Recurrent Auto — Fastest Charging EVs in 2026
- InsideEVs — Your EV Has a Max Charging Rate
- S&P Global — The Journey Towards Efficient EV Charging
- Electrifying.com — LFP vs. NMC Batteries
- Journal of Power Sources — Degradation Cost of Frequent Fast Charging Across Multiple Chemistries (2025)
- Advanced Energy — How DC Fast Charging Works


Leave a Reply
You must be logged in to post a comment.