


The sticker price on a new car is the number that gets all the attention. It’s printed on the window, advertised on TV, debated across the negotiation desk. It’s also the smallest piece of what that vehicle will actually cost you. According to AAA’s 2025 Your Driving Costs study, the average new vehicle costs $11,577 per year — or $964.78 per month — to own and operate. Multiply that by a typical 5-year ownership window, and you’re looking at roughly $58,000 in real-world spending on top of whatever the down payment, trade-in, and financing structure required.
Most buyers never run those numbers. They focus on the monthly payment, sign for the car they “can afford,” and discover the rest of the cost only when the bills arrive — fuel weeks, insurance renewals, tire replacements, brake jobs, and the eventual moment they realize their three-year-old vehicle is worth $15,000 less than they paid. Understanding total cost of ownership (TCO) before signing is the single most powerful financial habit in car buying. Buyers who run the math save tens of thousands of dollars over a few ownership cycles. Buyers who don’t subsidize the buyers who do.
This is the master breakdown for the Ownership Costs category — what TCO actually includes, what it costs in 2026, and how to use it to make better vehicle decisions. The other articles in this category dig into specific components in detail. This one shows you the whole picture.
What Total Cost of Ownership Actually Means
Total cost of ownership is the sum of every dollar a vehicle costs you from purchase to disposal. For a typical financed new vehicle, TCO includes seven major categories:
- Purchase price (vehicle, taxes, fees)
- Financing costs (interest paid over the life of the loan)
- Depreciation (loss in value over time)
- Fuel or electricity (energy to operate the vehicle)
- Insurance (annual premiums)
- Maintenance, repairs, and tires (everything keeping the vehicle running)
- Registration, license, and taxes (recurring government fees)
Some analyses add an eighth category — opportunity cost of the money tied up in the vehicle — which matters more for cash buyers and luxury purchases. Others fold maintenance and repair into a single line. The exact framework varies, but the underlying idea doesn’t: the sticker price is roughly 40-50% of what a new vehicle will cost you over the first five years of ownership. Everything else is what gets ignored.
The AAA Your Driving Costs methodology — the most widely cited TCO standard in the U.S. — assumes a 5-year, 75,000-mile ownership window across mid-priced, top-selling models. Their numbers exclude things like opportunity cost and incidental expenses (parking, tolls, washes), but they cover the major categories with consistent methodology that lets you compare across vehicle types. We’ll use AAA’s framework as the backbone here and supplement with Edmunds True Cost to Own and Kelley Blue Book 5-Year Cost to Own data where helpful.
Where Your Car Money Actually Goes
Before zooming into specific categories, it’s worth seeing the overall picture. Where does the average $11,577 in annual ownership cost actually go?

The single biggest cost is depreciation — $4,334 per year on average, or 37% of total ownership cost. That’s the silent cost most buyers ignore entirely because it doesn’t show up as a monthly bill. The second largest is fuel ($1,950), followed by insurance ($1,694), maintenance ($1,655), finance charges ($1,131), and registration/license/taxes ($813). Almost every major category is fluid — the buyer who chooses a high-depreciating luxury sedan can easily double the depreciation line, while the buyer who chooses a Toyota or Honda can cut it. Same with fuel (compact car vs. full-size pickup), insurance (sports car vs. minivan), and maintenance (German luxury vs. Japanese mainstream).
The implication is that vehicle choice — the brand and model on the badge — drives most of the cost variation, not luxury features or trim packages. A buyer who ignores TCO when shopping ends up paying a lot more for the privilege of not having looked.
Component 1: Purchase Price (and the Costs Bundled Into It)
The purchase price is the most obvious component, but it’s also the easiest to miscount. The “out-the-door” price you negotiate at the dealership is rarely just the sticker — it includes:
- Sales tax, which varies dramatically by state (0% in Oregon and New Hampshire to 9.5%+ in some Tennessee and Louisiana jurisdictions)
- Documentation fees (typically $100–$700 depending on dealer and state)
- Destination charges (usually $1,200–$2,200, included on the window sticker)
- Title and registration (one-time, varies by state)
- Dealer add-ons (paint protection, fabric protection, nitrogen tires — all typically poor value)
The negotiation that matters happens on the price before taxes — that’s the only piece the dealer controls. The taxes and fees are determined by your state and county. Knowing the breakdown protects you from the common dealer trick of agreeing to a low purchase price but adding margin back through documentation fees, mandatory add-ons, and inflated trade-in deductions. Our deeper coverage of how trade-in equity affects loan decisions covers the trade-in side of this dynamic, and our breakdown of how new cars depreciate over time covers why the price you pay matters far beyond the moment of purchase.
Component 2: Financing Costs
If you’re paying cash, this category is zero. If you’re financing — as roughly 80% of new-car buyers do — financing is one of the largest and most overlooked TCO categories. AAA estimated average annual finance charges at $1,131 in 2025, but that average masks enormous variation.
Finance charges are determined by three variables:
The amount financed. A larger loan means more interest paid over the same term. A buyer who puts 20% down on a $40,000 vehicle has a $32,000 loan; the buyer who puts nothing down has a $40,000 loan. Same vehicle, materially different interest cost.
The interest rate (APR). As of early 2026, average new-car APRs range from roughly 4.66% for super-prime borrowers (credit scores 781+) to 16% for deep subprime (300–500). On a $35,000 loan over 72 months, that spread translates to over $14,000 in lifetime interest difference. See how interest rates impact car loans for the current rate climate and what’s driving it.
The loan term length. Stretching from 60 months to 84 months reduces the monthly payment but inflates total interest paid by 35-50%. Edmunds reports 21.5% of new-car buyers in 2025 were on 84-month loans. Longer terms also keep buyers underwater on the loan for years, magnifying every other cost. Our breakdown of how loan terms affect total cost of ownership covers this in depth — including the math on why 60 months is the practical ceiling for most buyers.
The financing decision compounds. A buyer with a 9% APR on an 84-month loan with no down payment can pay $13,000+ more in lifetime interest than a buyer with 5% on a 60-month loan with 20% down on the same vehicle. That’s not a hypothetical — it’s the standard spread between thoughtful and unthoughtful financing on the same purchase.
Component 3: Depreciation
Depreciation is the single largest cost of vehicle ownership, and the one buyers think about least. It’s the difference between what you paid for the vehicle and what it’s worth at any given moment, and it accumulates whether you drive the car or not.
The average new vehicle loses 20% of its value in year one, 40% by year three, and 55-60% by year five. AAA’s 2025 study put annual depreciation at $4,334 per year — 37% of total ownership cost. But the spread across vehicles is enormous. A Toyota Tacoma loses about 35% of its value over five years; a Mercedes-Benz S-Class can lose 60-70%. Same dollars on the line, very different outcomes.
The factors that drive depreciation:
- Brand reputation for reliability. Toyota, Honda, Lexus, Subaru, Hyundai/Kia retain value better than European luxury brands and most American sedans
- Vehicle segment. Trucks (-34.8% over 5 years) and hybrids (-35.4%) hold value best. EVs depreciate fastest (-57.2%) due to rapid technology improvements and aggressive new-car price cuts. Luxury vehicles average -48.1%.
- Mileage. Vehicles driven significantly more than the U.S. average (13,500 mi/yr) depreciate faster
- Condition and history. Accident-free vehicles with documented service records command premium resale prices
- Aggressive new-car incentives. When manufacturers slash new-car prices (especially common for EVs from Tesla, Ford, and others), the value of existing used vehicles in the same segment drops in tandem
The way to manage depreciation is to factor it into the buying decision before signing, not after the fact. A vehicle’s projected resale value matters as much as its purchase price for total cost. Our deep dive on how new cars depreciate over time covers brand-by-brand depreciation patterns and which vehicles consistently retain value best.
Component 4: Fuel (or Electricity)
Fuel is the most volatile TCO component — it can swing dramatically year-over-year based on gas prices, and it varies by 3-4x across vehicle types. AAA’s 2025 study put average fuel cost at 13.0 cents per mile across the fleet ($1,950/year at 15,000 miles). But that was based on $3.15/gallon gasoline averaged over a 12-month period ending in May 2025. The world has changed since.
The 2026 Iran/Strait of Hormuz crisis pushed U.S. average gas prices to $4.30/gallon by late April 2026 — roughly 36% above the pre-crisis baseline. At that price, the same average vehicle costs $2,650/year in fuel, not $1,950. For an F-150 driver at 18 MPG, the increase is even larger — roughly $1,500/year in additional fuel costs versus pre-crisis levels.
Fuel costs vary structurally by vehicle type:
- Compact car (35 MPG): ~$1,650/year at $4.30/gal, 13,500 miles
- Hybrid (48 MPG): ~$1,200/year
- Compact SUV (24 MPG): ~$2,400/year
- Full-size pickup (18 MPG): ~$3,200/year
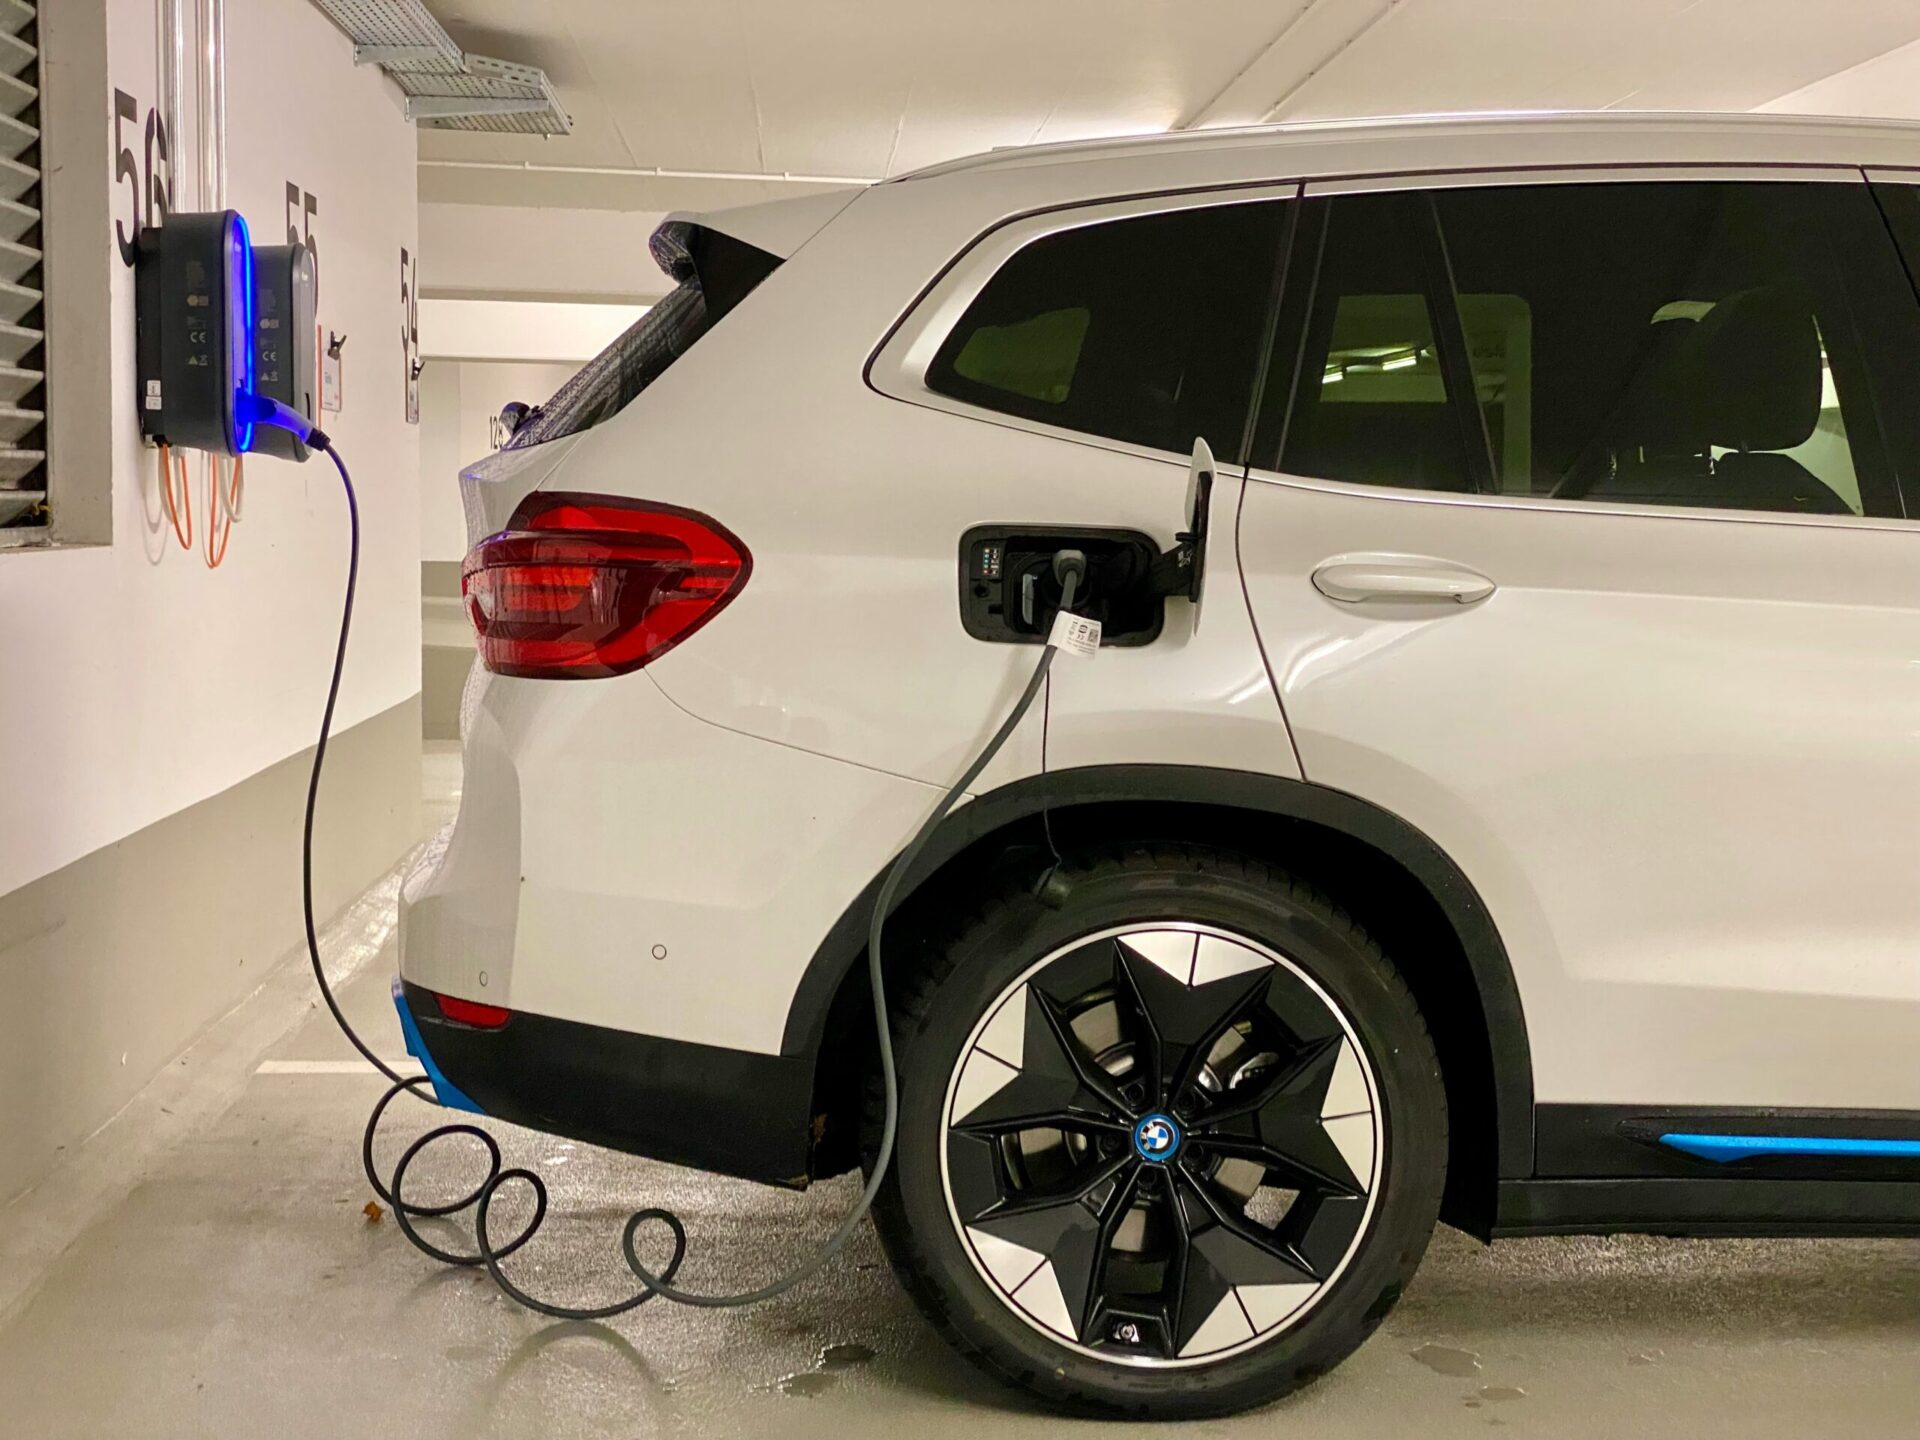
- EV at home charging: ~$610/year (insulated from oil price shocks)
These differences compound dramatically over a 5-year ownership window. A pickup driver pays $7,000+ more in fuel over five years than a hybrid driver, even at moderate gas prices. At crisis prices, that gap exceeds $10,000.
Beyond vehicle choice, the structural decisions matter too — commute distance, geographic location, driving habits, and whether you have access to home EV charging if you go electric. Our deep coverage of how fuel prices affect car ownership breaks down the current crisis and the strategies for insulating your transportation budget from future fuel shocks.
Component 5: Insurance
Auto insurance is the cost most affected by factors outside the vehicle itself — your driving record, age, ZIP code, credit score, and chosen coverage levels can swing premiums by 200-400% on the same vehicle. AAA’s 2025 study put the national average for full-coverage on a new vehicle at $1,694/year, but that’s a fleet average masking enormous variation.
Vehicle-specific factors that affect insurance:
Vehicle value. More expensive vehicles cost more to repair or replace if totaled. A Tesla Model 3 typically insures for 30-50% more than a comparable Toyota Camry — partly because of vehicle cost, partly because of higher repair costs (covered below).
Repair cost and parts availability. Vehicles with expensive parts and specialized repair requirements cost more to insure. Mercedes-Benz, BMW, and most EVs run high. Toyota, Honda, and Hyundai run low.
Theft rate. Certain models (Hyundai Sonata, Kia Optima with TikTok-driven thefts in 2022-2024, Honda Civic, Ford F-150) have higher theft rates that lift comprehensive coverage costs.
Safety and crash test ratings. Vehicles with strong IIHS and NHTSA ratings often qualify for safety discounts. Vehicles with poor ratings cost more.
Driver demographics. Sports cars and high-performance vehicles attract drivers with worse-than-average claim rates, lifting premiums even for safe drivers. Family sedans and minivans get the best rates.
The geographic variation is just as important. Florida, Michigan, and Louisiana drivers pay 50-80% more than national average. Vermont, Maine, and Idaho drivers pay 30-40% less. ZIP-code-level variation within a state can be 2-3x.
For TCO purposes, the practical move is to get insurance quotes before purchasing a specific vehicle, not after. A vehicle with $1,200 higher annual insurance is paying $6,000 more over five years — a meaningful component of the total cost-of-ownership picture that buyers routinely discover only after the deal is signed.
Component 6: Maintenance, Repairs, and Tires
This is the category that grows over time. New vehicles require very little — usually just oil changes, tire rotations, and the occasional cabin filter for the first 36-50,000 miles. After year five, when most factory warranties have expired and major components start showing wear, costs accelerate sharply.
AAA’s 2025 study put average maintenance, repair, and tire costs at $1,655/year, or about 11 cents per mile. But that’s averaged across all vehicle ages within a 5-year window. The actual trajectory looks more like:
- Years 1–3: $400–$700 per year (mostly routine maintenance, often covered partially by warranty)
- Years 4–5: $1,200–$1,800 per year (warranties expiring, first major service intervals)
- Years 6–8: $1,800–$3,000+ per year (timing belts, brakes, batteries, suspension components)
- Years 9–10+: Highly variable — often $2,500–$5,000+ per year if expensive systems fail
Brand and model matter enormously here. AAA, Consumer Reports, and J.D. Power consistently identify the same patterns:
Lowest 10-year maintenance costs: Toyota, Lexus, Honda, Mazda, Hyundai Average 10-year maintenance costs: Subaru, Ford (cars), Chevrolet, Nissan Highest 10-year maintenance costs: Land Rover, BMW, Mercedes-Benz, Audi, Jaguar, Porsche
The gap is meaningful. A 10-year-old Toyota Camry can cost $5,000-$6,000 less to maintain than a 10-year-old BMW 5 Series over the same period. EV maintenance is structurally lower than ICE — no oil changes, no transmission fluid, fewer brake replacements (regenerative braking) — but battery and ADAS-related repairs out of warranty can be expensive when they occur.
Regional factors matter too. Vehicles operated in salt-belt states (Michigan, Ohio, Pennsylvania, New England) accumulate undercarriage damage faster than vehicles in the South or Southwest, raising long-term repair costs by $1,500-$3,000+ over a 10-year window. Our breakdown of used car reliability by region covers this in detail. Our coverage of hidden costs of owning an older vehicle covers the year-by-year maintenance escalation curve.
Component 7: Registration, License, and Taxes
This is the smallest TCO component but the most state-dependent. AAA estimated the national average at $813/year, but that figure reflects everything from $50/year in some Midwestern states to $1,500+/year in Virginia and Massachusetts (where personal property tax on vehicles is annual).
The major recurring costs:
- Registration renewal (annual or biennial, $50-$500+ depending on state)
- Vehicle license fees (often value-based — newer/more expensive vehicles cost more)
- Personal property tax (in 27 states, including VA, MA, MO, MS, RI)
- Emissions inspection (in 33 states, $25-$50 every 1-2 years)
- Safety inspection (in 16 states, $15-$50 annually)
For most buyers, this is a fixed cost that doesn’t change the buying decision — you live where you live. But for buyers near state lines, the difference can be a real consideration. A Massachusetts vs. New Hampshire move can save $400-$800/year on personal property tax. A Virginia driver moving to North Carolina can save similarly.
Vehicle Type Comparisons: What 5-Year TCO Actually Looks Like
The component breakdowns matter, but the bottom line is what gets buyers focused. Here’s how 5-year TCO actually breaks down across the major U.S. vehicle types, using AAA’s 2025 methodology:

The spread is dramatic. A small sedan (Honda Civic class) runs about $48,950 in 5-year TCO. A large pickup (F-150 class crew cab) runs $83,580 — over $34,000 more for the same five years and 75,000 miles. The compact SUV class (Honda CR-V, Toyota RAV4) sits in the $57,000-$60,000 range. EVs run higher than their gas equivalents in 2025 ($66,100 average) because of the depreciation and finance costs that aren’t fully offset by lower fuel and maintenance.
The takeaway: vehicle category matters more than trim, color, or feature package. A buyer who chooses a small sedan or hybrid over a large SUV or truck saves enough over five years to fund a substantial portion of their next vehicle.
Real-World Vehicle Comparison: Camry vs CR-V Hybrid vs Model 3 vs F-150
Class averages are useful, but most buyers think in terms of specific models. The numbers below are model-specific estimates aligned to AAA’s methodology — and they will differ from the class averages in the previous chart. The Tesla Model 3, for example, comes in well below AAA’s $66,100 EV class average because it has a lower starting price than most EVs in AAA’s sample, retains value better than the EV-class average, and benefits from Tesla’s lower routine maintenance costs. The same dynamic applies in reverse for less-efficient pickups within the truck category. Here’s how four popular 2025 vehicles stack up over a 5-year, 75,000-mile ownership window:

Toyota Camry (Medium Sedan): ~$47,900 over 5 years The benchmark for mainstream affordability. Strong fuel economy, low maintenance, excellent value retention. Insurance and depreciation both run in the average range. The Camry is what TCO calculators use as a baseline.
Honda CR-V Hybrid (Compact SUV Hybrid): ~$48,200 over 5 years Slightly higher initial price than the Camry but partially offset by better fuel economy (40 MPG combined) and exceptional value retention. The hybrid premium recovers in 2-3 years at moderate gas prices, faster at crisis prices. Maintenance runs slightly above gas-only Hondas due to the hybrid system but still well below average.
Tesla Model 3 (Mid-Size EV): ~$50,000 over 5 years The lowest fuel/energy cost in the comparison ($3,200 over 5 years at home charging) and lower maintenance (no oil changes, no transmission service). But faster depreciation (Tesla has cut new-car prices repeatedly), higher insurance (more expensive to repair, ADAS sensors), and finance charges based on a higher purchase price push the total above the Camry. The Model 3 wins for high-mileage drivers with strong charging access; it’s neutral or slightly negative for moderate-mileage suburban drivers.
Ford F-150 (Full-Size Pickup): ~$68,900 over 5 years The premium for capability is real. Higher purchase price, dramatically higher fuel cost ($11,000 over five years even at moderate prices, more during the current crisis), higher insurance, and steeper depreciation in absolute dollar terms. The F-150 makes financial sense if you genuinely use it for towing, hauling, or work — but as a daily commuter, it’s a $20,000 premium over the Camry for capability you might rarely use.
The pattern is consistent across other comparisons: vehicles in higher-priced segments cost dramatically more across nearly every TCO category, not just the purchase price. Doubling the segment (compact car → full-size truck) roughly doubles the 5-year cost of ownership.
How TCO Shifts Over the Ownership Window
So far we’ve looked at TCO as a single five-year number. That’s useful for comparing vehicles, but it hides something important: the composition of your annual cost shifts dramatically as the vehicle ages. The buyer who walks in expecting roughly even annual costs is in for a surprise — both early and late in the ownership window.
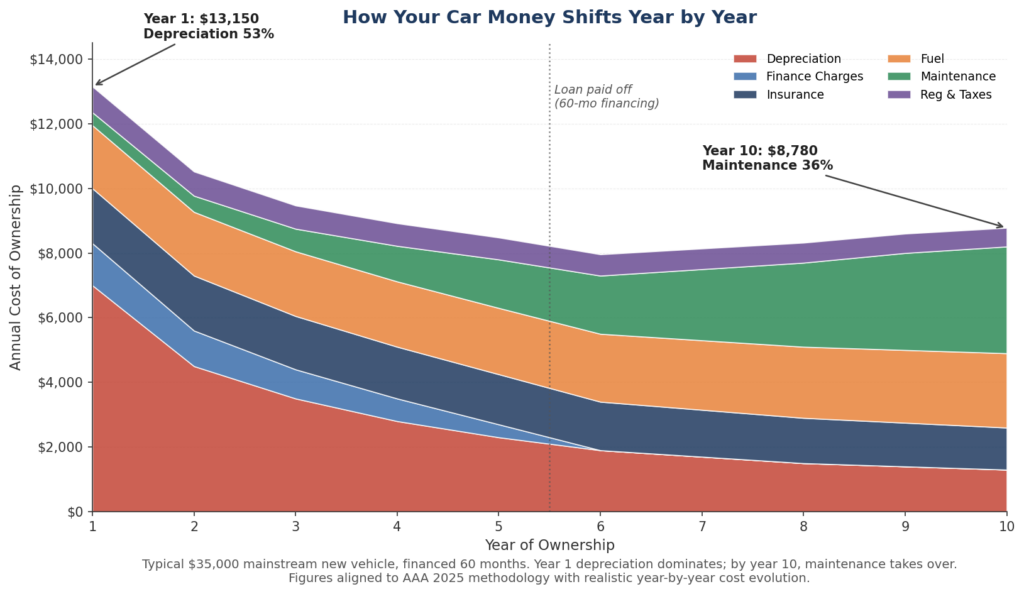
The chart above tracks annual ownership cost across a 10-year window for a typical $35,000 mainstream new vehicle. A few patterns worth understanding:
Year 1 is the most expensive year, by far. Roughly $13,150 in total cost — driven almost entirely by depreciation ($7,000, or 53% of the year’s total). Insurance is at its peak (vehicle is most valuable), and finance charges front-load on amortizing loans. Most new-car buyers don’t realize how heavily Year 1 weighs against them.
Years 2–5 ease downward as depreciation slows and the principal portion of loan payments builds equity. By year 5, annual cost is roughly $8,000-$8,500, depending on maintenance variability.
Year 6 sees a sharp drop as the loan is paid off and the finance line zeroes out. This is the cheapest year of ownership for most buyers — the one cited in “the years after the loan is paid off” personal finance advice.
Years 7-10 see costs creep back up as maintenance accelerates. By year 10, maintenance has risen from $400/year (Year 1) to $3,300/year (36% of total cost) on a typical mainstream vehicle. Brand and model matter enormously here — a Toyota or Honda can hold maintenance under $2,000/year through year 10, while a BMW or Mercedes-Benz can easily exceed $3,500/year.
The practical implication: the “cheapest year of ownership” mathematically arrives in year 6 (loan paid, depreciation slow, maintenance still moderate), and stays cheap through year 8 or 9 on reliable brands. Buyers who flip vehicles every 3-4 years never reach this part of the curve. They live perpetually in the most expensive years of ownership cost.
This is exactly why the hidden costs of owning an older vehicle become a major decision point around year 8-10: maintenance becomes the dominant cost, and the math of “keep vs. replace” shifts in ways many owners don’t recognize until they’re already in the middle of an expensive repair.
How to Use TCO Before You Buy
The hard part of TCO isn’t the math — it’s running it before you’ve already committed to a vehicle. A few practical steps:
Use the AAA Your Driving Costs calculator. AAA’s tool takes a state and a specific make/model and produces a personalized estimate. Run it for every vehicle you’re seriously considering before you visit a dealership.
Run Edmunds True Cost to Own and KBB 5-Year Cost to Own as cross-checks. Edmunds TCO and KBB’s 5-year cost calculator use slightly different methodologies than AAA. If all three agree on relative ranking, you have a reliable answer. If they disagree significantly, dig into why before deciding.
Get insurance quotes on actual VINs. Most insurance comparison tools require a specific vehicle. Get a real quote on the actual model and trim before you sign — including for any vehicles you’re seriously considering as alternatives.
Map your fuel costs honestly. Use 13,500 miles/year as the U.S. average if you don’t know your annual mileage — but if you commute 30+ miles each way, run it at 18,000-20,000 miles. Use the worst-case fuel price you’re willing to absorb (currently $4.30/gallon at the high end), not the optimistic baseline.
Factor in financing realistically. If your credit qualifies for 6.5% over 60 months, run the math at that rate, not at the manufacturer’s promotional 2.9%. Promotional rates are limited to specific buyers, specific terms, and specific vehicles — they’re real but rare.
Compare 5-year totals, not monthly payments. The dealership’s preferred conversation is monthly payment because it lets them obscure total cost. Yours should be 5-year total cost, because that’s the actual financial commitment.
Why How You Buy Matters as Much as What You Buy
One of the most counterintuitive findings of running TCO honestly is how much the buying decisions — credit profile, lender, loan term, down payment, F&I add-ons — affect the total. Two buyers walking out with the same vehicle can have wildly different 5-year costs based purely on how they financed and structured the deal.
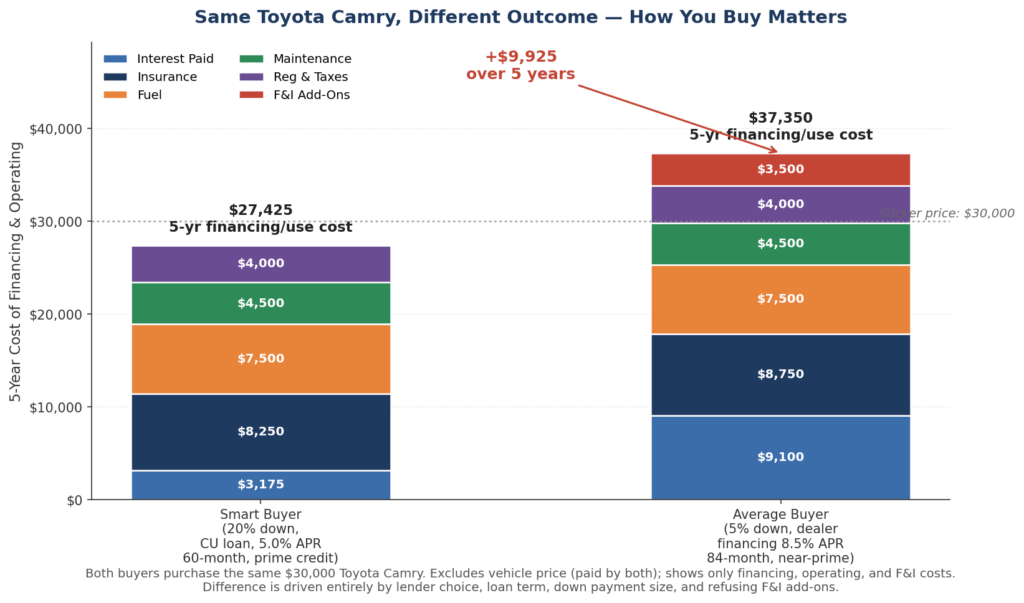
The chart above shows two buyers, both purchasing a $30,000 Toyota Camry. Same vehicle, same year, same dealership.
The Smart Buyer got pre-approved at a credit union (5.0% APR, prime credit), put 20% down, financed over 60 months, and refused F&I add-ons. Total 5-year financing and operating cost: $27,425.
The Average Buyer accepted dealer-arranged financing (8.5% APR, near-prime credit), put 5% down, financed over 84 months, and accepted $3,500 in F&I add-ons (extended warranty, GAP insurance, fabric protection). Total 5-year financing and operating cost: $37,350.
The gap is $9,925 over 5 years on the same vehicle. That’s not because one buyer drove differently or got a worse deal on the car itself. It’s purely the structure of the purchase:
- $5,925 difference in interest paid (longer term + higher rate)
- $3,500 in F&I add-ons the dealer profited from but rarely deliver value
- $500 difference in 5-year insurance (slightly different risk profile)
This is why the loan terms, trade-in equity, and interest rate articles in this content network exist as separate deep-dives — each of those decisions individually swings TCO by thousands of dollars, and they compound. A buyer who optimizes all three saves five-figure amounts compared to a buyer who optimizes none of them. That’s not theoretical. It’s the difference between Smart Buyer and Average Buyer in the chart above, sustained across multiple ownership cycles.
The good news: these are all decisions within your control before you sign. The dealership doesn’t get to choose your credit union pre-approval, your down payment, your refusal of add-ons, or whether you cap the loan at 60 months. Those are yours.
When TCO Should Override Your Preferences
For most buyers, the right vehicle isn’t the one they love most — it’s the one with the best TCO that meets their actual needs. There are a few scenarios where TCO matters most:
You have a tight budget. A buyer financing 80%+ of their household income on a vehicle is structurally fragile. A small-sedan TCO ($48K over 5 years) versus a large-SUV TCO ($72K over 5 years) is the difference between absorbing an unexpected cost and going into debt for it.
You drive a lot. High-mileage drivers (20,000+ miles/year) feel every fuel cost increase, every maintenance interval, and every depreciation hit twice as much as the average driver. Choose for efficiency.
You’re young or have moderate income. The vehicle you buy in your 20s or early 30s shapes your savings rate for the next 30 years. A buyer who spends $300/month less on TCO and invests the difference at 7% over 30 years ends up with $367,000 more in retirement.
You drive an aging vehicle. When deciding whether to repair an older vehicle or replace it, run TCO on both options. Repairs at $3,000 may be cheaper than a new vehicle’s $11,500/year — but only up to a point. After that point, the math flips.
There are also scenarios where TCO matters less:
You genuinely use the truck. A contractor, farmer, or rural household with active work needs gets value from a pickup that doesn’t show up in the TCO comparison. Don’t optimize a tool down to a utility it doesn’t have.
Your income is high relative to vehicle cost. A buyer making $300K/year doesn’t need to optimize TCO on a $50K vehicle to the same degree. The financial impact is real but small relative to overall finances.
You truly love the car. Cars aren’t just appliances. There’s a place in TCO analysis for accepting a worse financial outcome for a vehicle you’ll genuinely enjoy for the years you own it. The point isn’t to remove that — it’s to know what you’re paying for the privilege, and to make sure you can afford it.
The Bottom Line on TCO
The total cost of owning a car in 2026 averages $11,577/year — close to $58,000 over five years for a mainstream new vehicle. That’s the financial commitment most buyers underestimate by 40-50% when they shop based on monthly payment alone. The buyers who do best in this market run TCO before signing: they know where their money will go, they make vehicle choices that align with their actual driving and budget, and they refuse to be moved into payments they can’t sustain across the full ownership window.
The good news: TCO is knowable. AAA, Edmunds, and KBB all publish detailed methodologies. The components are predictable. The differences between vehicles are documented. The bad news: most buyers never run the math because the dealership’s whole conversation is designed to keep them focused on monthly payment instead. The buyers who break out of that frame — who insist on seeing 5-year totals, who run the math on multiple vehicles before visiting any of them, who treat the purchase as a 5-year financial commitment rather than a single-day decision — are the ones who keep the savings.
The sticker price is the smallest line item in the document you’re really signing for. Treat it that way.
Sources and Further Reading
- AAA — 2025 Your Driving Costs Study
- AAA — Your Driving Costs Calculator
- Edmunds — True Cost to Own
- Kelley Blue Book — 5-Year Cost to Own
- Kelley Blue Book — AAA: It Costs $11,577 a Year to Drive
- NerdWallet — What Is the Total Cost of Owning a Car?
- Consumer Reports — Car Reliability and Owner Satisfaction
- Experian — State of the Automotive Finance Market
- iSeeCars — Cars That Hold Their Value Best Study
- Bankrate — Auto Loan Rates and Average Monthly Payments
- U.S. Department of Energy — Vehicle Cost Calculator
- Federal Highway Administration — Average Annual Miles Per Driver


Leave a Reply
You must be logged in to post a comment.